

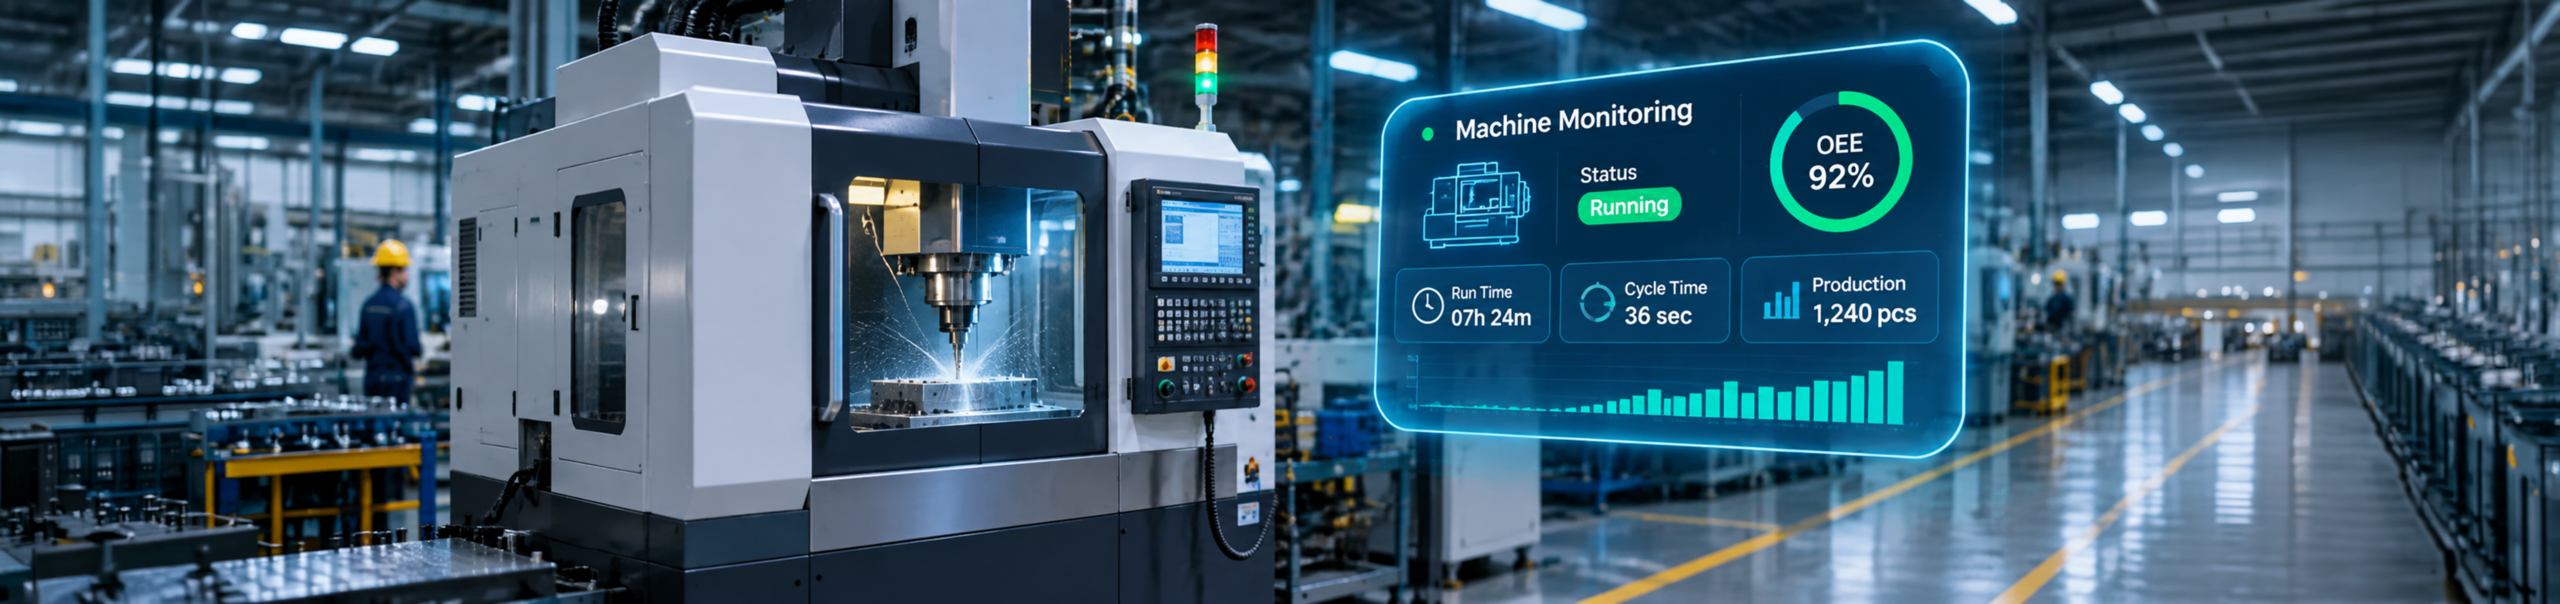
A machine monitoring system captures data directly from production equipment, whether that's a CNC controller, a PLC, or a retrofitted sensor, and turns it into live visibility on utilization, downtime, and performance. This guide covers how the technology actually works under the hood, the metrics worth tracking, what it costs manufacturers to go without it, and how to evaluate a system against your own shop floor, your own machines, and your own ERP or MES.
Navigate to section

- 1. What is a Machine Monitoring System?
- 3. Core Components: Hardware and Software Working Together
- 5. Importance of Machine Monitoring System in Manufacturing
- 7. Real-Time vs. Historical vs. Predictive Machine Monitoring
- 9. How to Choose a Machine Monitoring System
- 11. Practical Implementation Process for Machine Monitoring
- 1. What is a Machine Monitoring System?
- 2. How does a Machine Monitoring System Work?
- 3. Core Components: Hardware and Software Working Together
- 4. What Key Metrics Should a Machine Monitoring System Track?
- 5. Importance of Machine Monitoring System in Manufacturing
- 6. Benefits of a Machine Monitoring System
- 7. Real-Time vs. Historical vs. Predictive Machine Monitoring
- 8. Machine Monitoring vs. MES vs. OEE Software: Where It Fits
- 9. How to Choose a Machine Monitoring System
- 10. How Machine Monitoring Works Inside Smart Factory MOM
- 11. Practical Implementation Process for Machine Monitoring
A machine monitoring system captures data directly from production equipment, including cycle times, downtime, machine status, part counts, without requiring an operator to record everything manually. For manufacturers still relying on end-of-shift reports or paper travelers, machine monitoring provides a direct way to see what is actually happening on the shop floor during production.
The basic idea is straightforward: connect production equipment, automatically capture operating data, put that data into context, and make it available to the people responsible for production. The complexity comes from the machines themselves. A modern CNC, a PLC-controlled assembly station, and a fifteen-year-old machine with a stack light, each may require different approaches to data collection.
A useful machine monitoring system therefore must do more than display machine status on a dashboard. It needs to capture reliable signals, distinguish actual production losses from normal machine behavior, retain historical data, link production information to the appropriate work order or part, and present the information in a way that operators, supervisors, maintenance teams, and plant managers can use.
This guide explains how machine monitoring systems work in manufacturing, what data they collect, which metrics are useful, how they connect with OEE, MES, and MOM software, what to consider when selecting a system, and how manufacturers can introduce machine monitoring without creating another disconnected system on the shop floor.
What is a Machine Monitoring System?
A machine monitoring system is a combination of hardware and software that connects directly to production equipment and automatically collects operating data, without an operator writing anything down. Depending on the machine and the monitoring setup, the system can track:
- Machine running, idle, and stopped status
- Cycle time
- Production counts
- Good and rejected parts
- Downtime duration and reasons
- Machine alarms and fault conditions
- Actual production rate compared with the ideal cycle
- Equipment utilization
- Maintenance-related signals
- Process conditions such as temperature, pressure, torque, or vibration
It tracks whether a machine is running, idle, or down; how fast it's cycling relative to its ideal rate; and how many good and rejected parts it's producing. It does this continuously, in the background, for as long as the machine is on.
Machine monitoring is the data capture layer that further connects to OEE tracking, Andon boards, manufacturing analytics, and a full MES. The core job of a machine monitoring system is simple: replace assumptions with a signal that comes straight from the equipment.
How does a Machine Monitoring System Work?
The technology behind machine monitoring can vary from plant to plant, but the basic process is straightforward.
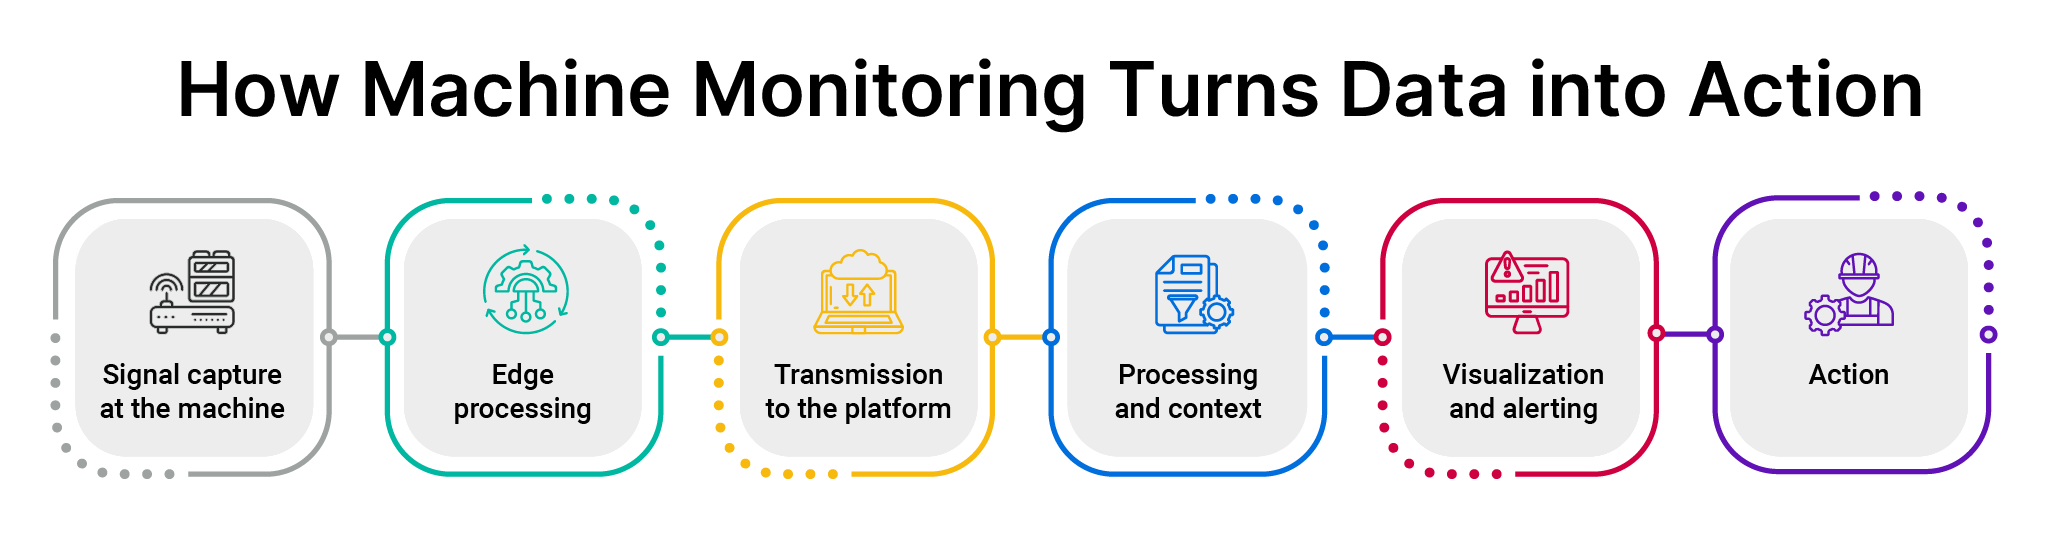
Signal capture at the machine
Modern CNC controllers, PLCs, and other industrial equipment already generate useful production data, including machine status, cycle information, alarms, spindle data, and part counts. A monitoring system can read this information directly via industrial communication protocols such as OPC-UA or MTConnect.
Older machines may not have this type of connectivity. In those cases, external sensors can detect signals such as machine movement, stack-light status, current draw, or vibration.
Edge processing
An edge gateway can sit close to the machines, collect and standardize incoming data and temporarily store information if the network connection is interrupted, helping prevent gaps in production records. It also keeps the system running through a brief Wi-Fi or internet blip; the edge device buffers data locally and syncs once connectivity returns.
Transmission to the platform
The processed information is sent to a central manufacturing platform, either in the cloud, on-premise, or through a hybrid setup.
Processing and context
Raw machine data is useful, but context makes it much more valuable.
For example, knowing that a machine stopped at 2:14 p.m. is useful. Knowing that it stopped for 11 minutes while producing a specific part during the second shift is far more actionable.
The system can connect machine data with work orders, part information, ideal cycle times, shifts, and other production information.
Visualization and Alerting
Operators, supervisors, maintenance teams, and managers can access the information they need through dashboards, Andon displays, reports, or alerts. The goal is not to give everyone the same dashboard. It is to give each role the information needed to respond.
Action
This is where machine monitoring delivers real value. Data by itself does not improve production. The value comes from using that data to identify a problem, understand its cause, and take action.
As Fernando Aguirre, Senior Solutions Consultant at Smart Factory MOM, explains, many manufacturers initially rely on spreadsheets and manual data entry. Connecting a machine often reveals discrepancies between what was assumed to be happening and what the equipment is actually reporting.
Core Components: Hardware and Software Working Together
A machine monitoring setup typically includes several components that work together. Two integral components of a machine monitoring system are hardware and software. Let’s understand each one in detail.
Hardware
- Controller-level connections: Connecting directly to a machine controller can provide detailed information, including cycle status, program details, alarms, and machine parameters.
- External sensors: Older equipment without a usable digital interface can be connected via sensors that monitor signals such as current, vibration, proximity, or stack lights.
- Edge gateways: Gateways collect and translate machine data and can temporarily store information when network connectivity is interrupted.
- RFID and barcode readers: These can add information that the machine cannot provide on its own, such as the active work order, operator, or material lot.
Software
The software layer turns machine signals into information that production teams can use. It typically includes:
- A data historian: A data historian for storing time-stamped machine information.
- An analytics and visualization engine: Dashboards and analytics for monitoring production performance.
- An alerting layer: Rules-based notifications (email, SMS, on-screen Andon) and alerts for downtime and other events.
- An integration layer: The connection back to ERP and MES, so ideal cycle times and work orders flow in, and completed job data, actual run time, scrap, labor, OEE, and production performance calculations flow back out.
The system can be deployed in the cloud, on-premise, or through a hybrid architecture, depending on the plant's IT, security, and connectivity requirements.
What Key Metrics Should a Machine Monitoring System Track?
Manufacturers do not need to monitor every possible metric from day one. A smaller set of useful metrics is often more valuable than a dashboard filled with numbers that no one reviews. Here's the core set to start with:
| Metric Category | Representative Metrics | Why It Matters |
|---|---|---|
| OEE Components | Availability, Performance, Quality | The single most referenced manufacturing KPI; breaks total loss into a diagnosable structure. |
| Six Big Losses | Breakdowns, changeovers, small stops, slow cycles, startup rejects, process rejects | Turns "we lost time" into "we lost time because of this specific, addressable cause." |
| TEEP | Utilization, schedule loss | Reveals hidden capacity in unscheduled or underused hours, useful before approving new capital equipment. |
| Downtime | Total downtime, downtime by reason, longest events | Root-cause visibility for downtime tracking and Pareto-style prioritization. |
| Cycle Time | Actual vs. ideal cycle time, cycle time variance | Exposes machines quietly running slower than spec, often the largest and least-visible loss category. |
| Maintenance Health | MTBF, MTTR, vibration/temperature trend | Foundation for shifting from reactive to predictive maintenance. |
| Utilization | Run hours vs. available hours, by shift and by machine | Identifies underused equipment before anyone approves a new machine purchase. |
The key point is to start with metrics that support real production decisions rather than trying to measure everything at once.
Importance of Machine Monitoring System in Manufacturing
Production teams cannot improve what they cannot see. When downtime, cycle time, and production losses are recorded manually, some events will inevitably be missed. A short stop may not seem important enough to record, but repeated short stops can accumulate into significant lost production time.
Machine monitoring provides a more consistent view of what is happening across the shop floor. It can help manufacturers by:
- Identify downtime as it happens
- Understand the reasons behind production losses
- Compare actual and ideal cycle times
- Establish a more reliable OEE baseline
- Identify underused machine capacity
- Improve production planning with actual machine data
- Respond to problems before they affect an entire shift
- Build a historical record for continuous improvement
The workforce challenge also makes automated data collection more relevant. As production grows more complex, teams have less time to manually collect and reconcile shop-floor information.
Benefits of a Machine Monitoring System
The benefits depend on how the system is implemented and, more importantly, how the production team uses the information.
| Benefit Area | Typical Range |
|---|---|
| Increased production efficiency | 10–20% |
| Reduction in unplanned downtime | Up to 30% |
| Enhanced quality and compliance | 20–40% |
| Enhanced labor productivity | 10–20% |
| Reduced scrap and rework | 15–30% |
Reduced downtime
Real-time alerts can help teams respond to stoppages sooner. Historical downtime data also helps maintenance and production teams focus on recurring causes rather than isolated incidents.
Higher, more actionable OEE
A composite OEE score tells you something is wrong. Breaking it into availability, performance, and quality losses tells you what to fix first, which is the entire point of measuring it.
Improve scheduling and production planning
Actual cycle time and utilization data give planners a better understanding of what machines can realistically produce.
Instead of relying solely on historical assumptions, planners can use current production data when building schedules.
Improve quality
Monitoring process conditions and production information can help identify changes while production is still running. Catching a process problem early is generally easier than discovering it after a large quantity of parts has already been produced.
Find unused capacity
Machine utilization data can reveal where production capacity is being lost during scheduled operating hours. Sometimes the additional capacity a plant needs is already available; it is simply being lost to downtime, slow cycles, changeovers, or other production issues.
Real-Time vs. Historical vs. Predictive Machine Monitoring
Machine monitoring helps manufacturers understand what is happening on the shop floor in real time, identify patterns over time, and spot early signs of equipment problems. These capabilities serve different purposes, but they work best together as part of a connected monitoring strategy.
Real-Time Monitoring
Real-time monitoring is the operational layer. It gives operators and supervisors an immediate view of machine status. They can see when a machine stops, slows down, or falls behind its expected cycle time, and take action while the issue is still affecting production.
Historical/Trend Analysis
Historical machine monitoring helps manufacturers look beyond individual events. By reviewing data across shifts, machines, products, and time periods, teams can identify recurring issues that are easy to overlook during day-to-day production. For example, a particular machine may consistently perform below target on one shift, or changeover times may gradually increase without being noticed.
Condition-Based and Predictive Maintenance
It takes machine monitoring a step further. Data such as vibration, temperature, and current draw can help identify changes in equipment condition. With sufficient reliable historical data, analytics can highlight patterns that may indicate an impending failure, giving maintenance teams the opportunity to plan the work instead of responding to an unexpected breakdown.
For most manufacturers, the practical approach is to start with real-time visibility. Once reliable machine data is collected, historical analysis can help identify improvement opportunities. Predictive capabilities can then be added as sufficient quality data becomes available to support them.
Machine Monitoring vs. MES vs. OEE Software: Where It Fits
Machine monitoring, OEE software, MES, and MOM are often discussed together, but they serve different purposes. Understanding where each fits makes it easier to determine what your manufacturing operation actually needs.
| Layer | What It Actually Does | What It Depends On |
|---|---|---|
| Machine Monitoring | Collects equipment data such as run, idle, downtime, cycle time, and production counts. | Sensors, machine controllers, and connectivity protocols. |
| OEE Software | Uses machine and production data to calculate Availability, Performance, and Quality. | Machine data combined with production information. |
| MES | Connects production execution with work orders, routings, quality checks, and traceability. | Machine data combined with production and order information. |
| MOM (Manufacturing Operations Management) | Brings machine monitoring, MES, OEE, scheduling, workforce, and quality information together in one connected environment. | Data and processes across multiple manufacturing functions. |
In simple terms, machine monitoring provides the equipment data. OEE software is the calculation layer that uses that data to measure equipment effectiveness. MES software adds production context, such as which order is running, which operation is being performed, and which quality requirements apply.
A MOM platform integrates these capabilities so manufacturers can work with production information in a single environment rather than moving data between separate systems.
How to Choose a Machine Monitoring System
The right machine monitoring system is not necessarily the one with the longest feature list. The more important question is whether it can reliably connect to the machines you already have and deliver data that your teams can actually use.
Legacy equipment warrants particular attention during evaluation. A machine does not necessarily need to be replaced simply because it lacks modern connectivity. External sensors, data collection devices, or communication gateways can often be used to integrate older equipment into a monitoring system.
Before starting the rollout, understand what data the machine can provide, how you’ll collect it, and what level of accuracy to expect.
Machine and protocol compatibility
Check support for protocols such as OPC-UA, MTConnect, and Modbus, as well as compatibility with the controller brands used in your plant.
Legacy machine support
Ask how the system connects to machines without native digital connectivity and what information can realistically be collected from those machines.
Real-time Updates
If the system is used for live production monitoring, the data needs to be updated quickly enough for operators and supervisors to respond. Sub-second to second-level updates are required for anything feeding an operator-facing dashboard.
Role-based Dashboards
Different views for operators, supervisors, managers, and other users based on the information they require.
ERP and MES Integration
The ability to exchange production plans, orders, cycle information, completions, and actual production data with other systems.
Scalability
A clear path to scale from a pilot machine or production line to more equipment, departments, or plants.
Total Cost of Ownership
Consider hardware, software, implementation, integration, and ongoing support rather than focusing only on the initial license cost.
How Machine Monitoring Works Inside Smart Factory MOM
Smart Factory MOM uses its IIoT layer to collect and connect machine data, making it available to other areas of the platform, including OEE, MES, and analytics. The platform supports machine connectivity through protocols and communication methods used by both modern and legacy equipment.
Key capabilities include:
- Machine connectivity: Collect production information directly from connected equipment and data-collection devices.
- Andon reporting: Configurable shop-floor views display the current status of connected machines, helping teams identify downtime and production issues as they occur.
- Real-time dashboards: Role-based dashboards provide visibility from individual machines and operator stations to plant-level performance, including OEE and machine-level production data.
- Edge computing and digital twin capabilities: Data can be processed closer to the equipment to enable responsive monitoring. Digital twin capabilities can also help teams evaluate production scenarios using historical data before implementing changes to the production plan.
- Analytics: Use historical production data to identify trends and potential areas for improvement.
- Legacy equipment support: Connect older machines through suitable data collection devices or gateways instead of replacing equipment simply because it lacks modern connectivity.
Practical Implementation Process for Machine Monitoring
A machine monitoring project does not have to start with every machine in the plant. A phased rollout can make it easier to validate the technology, establish reliable data, and help teams become comfortable using it.
Phase 1 – Pilot on the constraint
Begin with a bottleneck or machine where downtime has a noticeable impact on production. Establish standard downtime categories before collecting data, to ensure information remains consistent from the start.
Phase 2 – Standardize and connect
Train operators on the monitoring workflow and verify that key inputs, such as ideal cycle times used in OEE calculations, are accurate. Where appropriate, integrate machine data with the ERP or MES, so production information can be viewed in context.
Phase 3 – Expand and add advanced capabilities
Once the initial setup is working reliably, extend monitoring to other machines and production areas. Condition monitoring and predictive capabilities can be introduced as sufficient historical data becomes available.
A few common implementation problems are worth avoiding, such as rolling out to too many machines before the team has built the habit of acting on the data; drowning a dashboard in every metric the software can technically display; and connecting machine data without linking it to ERP or MES, which leaves plant-floor visibility and business planning as two disconnected conversations instead of one.
Conclusion
Machine monitoring gives manufacturers a clearer picture of what is happening on the shop floor. Instead of waiting for production reports or relying on manual records, teams can see machine status, downtime, production counts, and performance in real time.
Technology does not replace people managing production. It gives them more reliable information to work with and helps them respond to problems before they cause larger production losses.
For manufacturers still tracking machine downtime manually, a practical starting point is to select one machine or production line where downtime has a meaningful impact. Connect to it, establish a reliable baseline, and use the data to pinpoint where production time is being lost.
Smart Factory MOM connects your machines, contextualizes the data with MES and OEE, and delivers real-time visibility to the people who can act on it.