
This blog provides a comprehensive breakdown of the most critical manufacturing KPIs required to monitor and improve production performance. It goes beyond basic definitions to explain how each KPI such as OEE, availability, performance, quality, downtime, MTTR, MTBF, and on-time delivery reveals specific operational inefficiencies on the shop floor. By understanding how these 12 KPIs interact, manufacturers can move from reactive reporting to proactive control, enabling better decision-making, reduced losses, and improved overall efficiency.
Navigate to section
- 1. What are Manufacturing KPIs?
- 2. Importance of Manufacturing KPIs in Smart Manufacturing
- 3. Types of Manufacturing KPIs to Track for Production Efficiency
- 4. Why OEE is the Most Critical Manufacturing KPI
- 5. Top Manufacturing KPIs to Track for Smart Manufacturing
- 6. Smarter Manufacturing with Smart KPI Tracking
Manufacturing performance is measured based on various aspects, not output alone. A manufacturing plan may be hitting production targets but still losing efficiency through downtime, rework, or inconsistent processes. That’s where manufacturing KPIs come into the picture.
In the competitive landscape, manufacturers are expected to operate with tighter margins, higher product variability, and stricter delivery timelines. In this environment, relying on assumptions or delayed reports is no longer practical. What matters is the ability to measure performance accurately and respond in real time. However, many plants still struggle with one fundamental issue: they track data, but not necessarily the right production metrics.
This is where a structured approach to manufacturing KPIs becomes critical. Among all metrics, OEE (Overall Equipment Effectiveness) stands out as one of the most important KPIs. But OEE alone is not enough; it must be supported by other production metrics to provide a complete picture of operations.
What are Manufacturing KPIs?
Manufacturing KPIs are measurable indicators used to evaluate how effectively a production operation is performing. These KPIs help manufacturers monitor efficiency, quality, downtime, and overall operational performance.
At their core, KPIs answer a simple question:
“Is the plant performing as expected, and if not, where are the losses?”
Manufacturing KPI vs Production Metric
The terms are often used interchangeably, but there is a practical distinction.
A production metric is any measurable data point, such as cycle time or output. A manufacturing KPI, on the other hand, is a metric that directly influences decision-making and performance improvement.
For example:
- Cycle time is a metric, but
- Cycle time variance affecting throughput becomes a KPI
In other words, KPIs are the metrics that matter most to your operations.
Importance of Manufacturing KPIs in Smart Manufacturing
In traditional setups, performance was often reviewed at the end of the shift or even the next day. By then, the opportunity to act had already passed. With the right manufacturing KPIs in place, manufacturers can:
- Identify production losses as they happen
- Respond to machine issues faster
- Align production with delivery commitments
- Improve coordination between production, maintenance, and quality teams
More importantly, KPIs shift the mindset from reactive problem-solving to proactive performance control. A well-defined KPI system doesn’t just report what happened; it helps teams understand why it happened and what needs to be done next. When used correctly, KPIs create alignment across the organization. Production, quality, and maintenance teams begin working from the same version of truth. Decisions become faster, more consistent, and more effective.
Types of Manufacturing KPIs to Track for Production Efficiency
A balanced KPI framework covers multiple aspects of production. Focusing on just one area, such as output, often leads to blind spots elsewhere.
Production Efficiency Metrics
These measure how effectively production resources are being utilized:
- Throughput
- Cycle Time
- Capacity Utilization
Quality Metrics
These reflect the consistency and reliability of production:
- First Pass Yield
- Scrap Rate
- Defect Rate
Equipment Performance Metrics
These focus on how well machines are operating:
- OEE KPI
- Availability
- Performance Rate
Downtime and Maintenance Metrics
These highlight reliability and maintenance efficiency:
- Planned vs Unplanned Downtime
- Mean Time to Repair (MTTR)
- Mean Time Between Failures (MTBF)
Delivery Metrics
These connect production performance to customer expectations:
- On-Time Delivery
- Schedule Adherence
Workforce Metrics
These evaluate how effectively labor is utilized:
- Operator Efficiency
- Labor Productivity
The key is not to track everything but to track what directly impacts performance and decision-making.
Top Manufacturing KPIs to Track for Smart Manufacturing
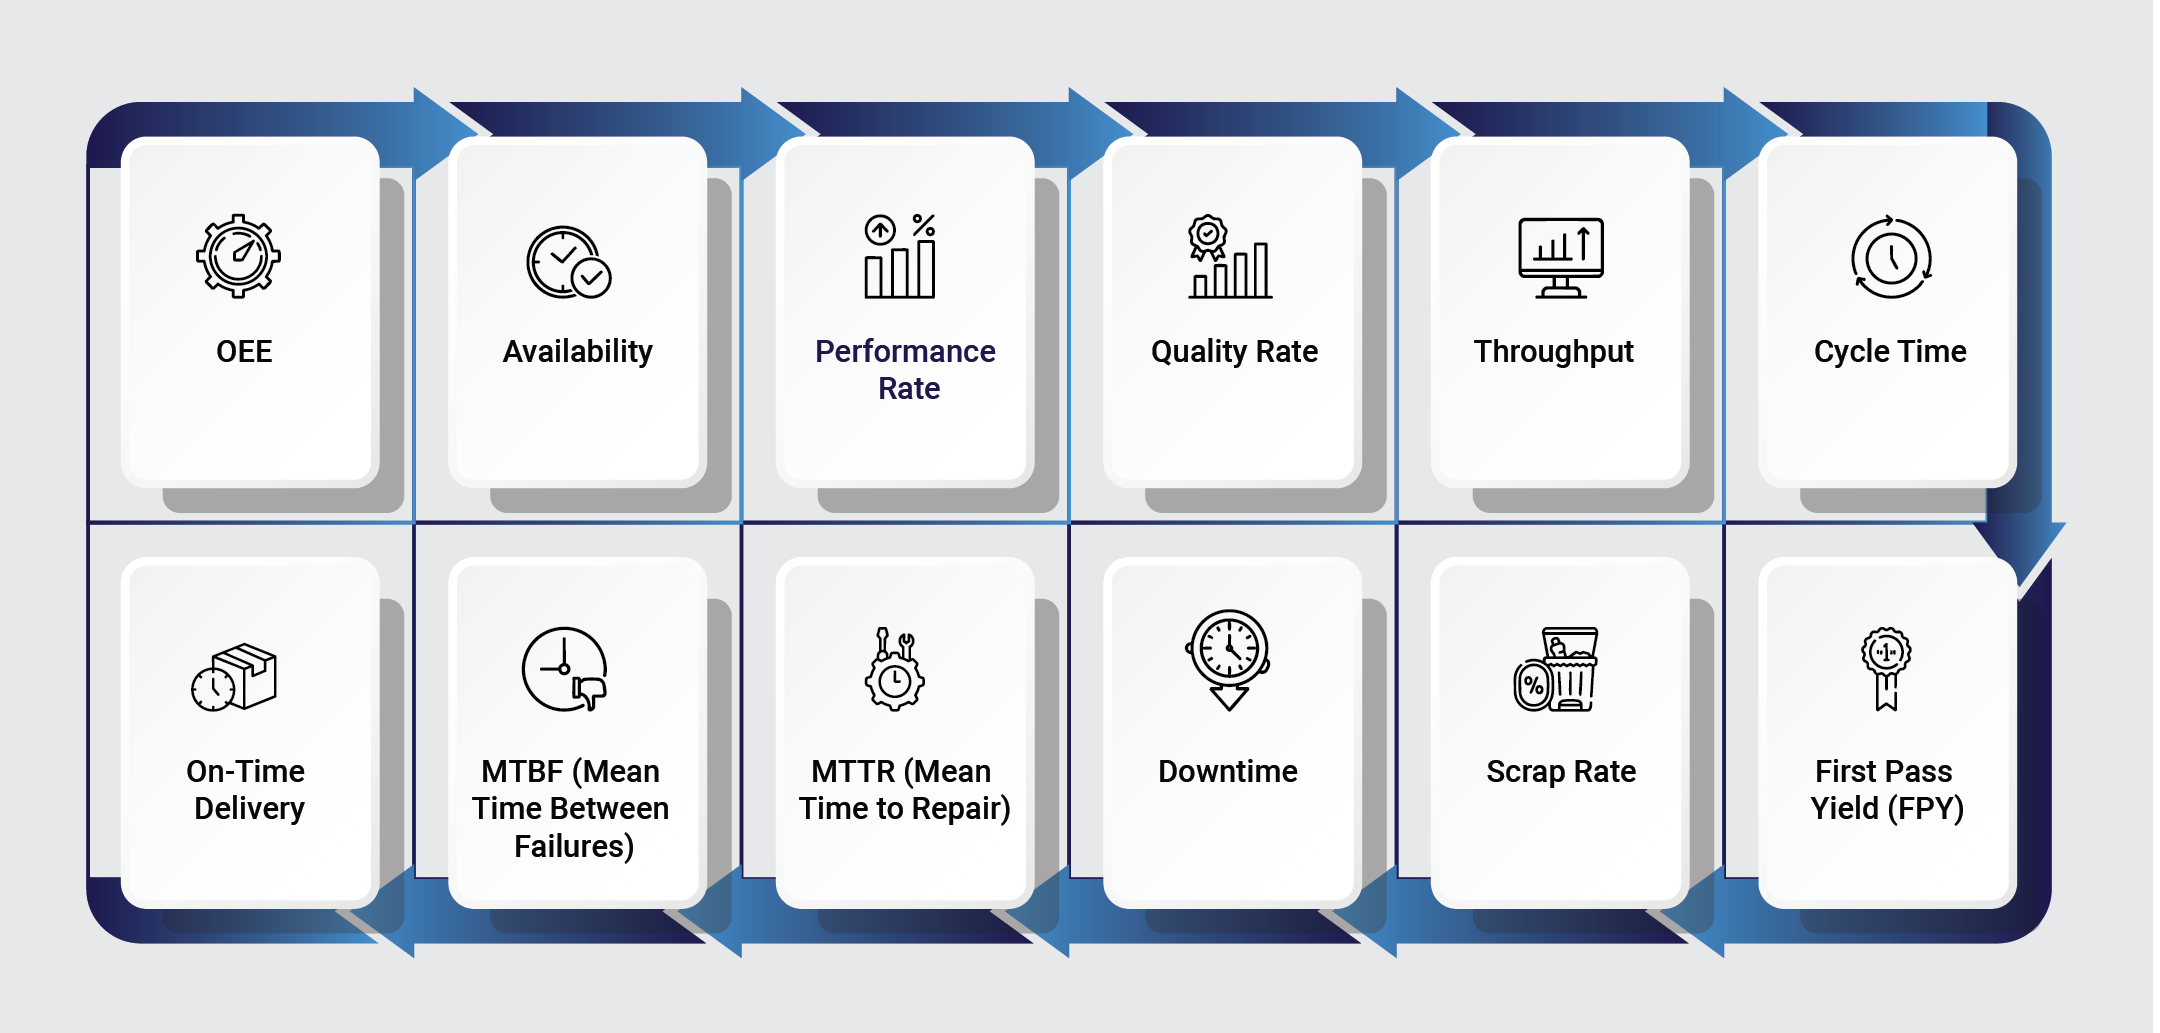
1. OEE (Overall Equipment Effectiveness)
OEE measures how effectively a machine or production line is utilized during scheduled production time. It captures all major sources of production loss in a single metric. OEE highlights:
- Equipment downtime (breakdowns, setups)
- Speed losses (slow cycles, micro-stoppages)
- Quality losses (defects, rework)
How it is Calculated
OEE = Availability × Performance × Quality
- Availability = Run Time / Planned Production Time
- Performance = (Ideal Cycle Time × Total Output) / Run Time
- Quality = Good Parts / Total Parts Produced
2. Availability
The percentage of planned production time during which equipment is actually running. It highlights:
- Equipment reliability issues
- Setup and changeover inefficiencies
- Unplanned downtime frequency
How it is Calculated
Availability = Run Time / Planned Production Time
3. Performance Rate
Performance rate measures how fast equipment is running compared to its ideal speed. It highlights:
- Speed losses
- Inefficient machine settings
- Operator-driven slowdowns
How it is Calculated
Performance = (Ideal Cycle Time × Total Output) / Run Time
4. Quality Rate
The quality rate measures the percentage of good parts produced without defects. It reflects the effectiveness of the production process in producing defect-free output. Quality rate highlights:
- Process stability
- Defect trends
- Rework and scrap impact
How it is Calculated
Quality = Good Parts / Total Parts Produced
5. Throughput
Throughput reveals the total number of units produced within a specific time period. However, throughput should always be evaluated alongside quality metrics to ensure output is not coming at the cost of defects. It highlights:
- Actual production capacity
- Bottlenecks in the process
- Line balancing issues
6. Cycle Time
Cycle time variation is often more critical than average cycle time. Cycle time is the time required to produce one unit from start to finish. It highlights:
- Process efficiency
- Delays in operations
- Impact of bottlenecks
7. First Pass Yield (FPY)
The percentage of products manufactured correctly without rework. Improving FPY reduces both cost and production time. It highlights:
- Process capability
- Hidden inefficiencies in rework loops
How it is Calculated
FPY = Good Units (without rework) / Total Units Produced
8. Scrap Rate
Scrap directly affects profitability. Even a small increase can lead to significant cost impact in high-volume manufacturing. Scrap rate measures the percentage of material that is rejected during production. It highlights:
- Material waste
- Process inefficiencies
- Quality issues
How it is Calculated
Scrap Rate = Scrap Units / Total Units Produced
9. Downtime
Downtime refers to periods when production is halted, either planned or unplanned. Unplanned downtime is particularly critical, as it disrupts production schedules and reduces overall capacity. Improving manufacturing downtime helps with reducing production cost and helps identify recurring issues and improve maintenance strategies. It hightlights:
It hightlights:
- Equipment reliability
- Maintenance effectiveness
- Operational discipline
10. MTTR (Mean Time to Repair)
The average time required to repair equipment after a failure. It highlights:
- Maintenance team efficiency
- Spare parts availability
- Issue response time
How it is Calculated
MTTR = Total Repair Time / Number of Failures
11. MTBF (Mean Time Between Failures)
The average time between equipment failures. It highlights:
- Equipment reliability
- Effectiveness of preventive maintenance
How it is Calculated
MTBF = Total Operating Time / Number of Failures
12. On-Time Delivery (OTD)
On-Time Delivery measures how reliably production meets customer delivery commitments. It reflects the percentage of orders delivered on or before the promised date. It reflects the percentage of orders delivered on or before the promised date. OTD reveals:
- Planning accuracy
- Production reliability
- Customer satisfaction
How it is Calculated
OTD = On-Time Deliveries / Total Deliveries
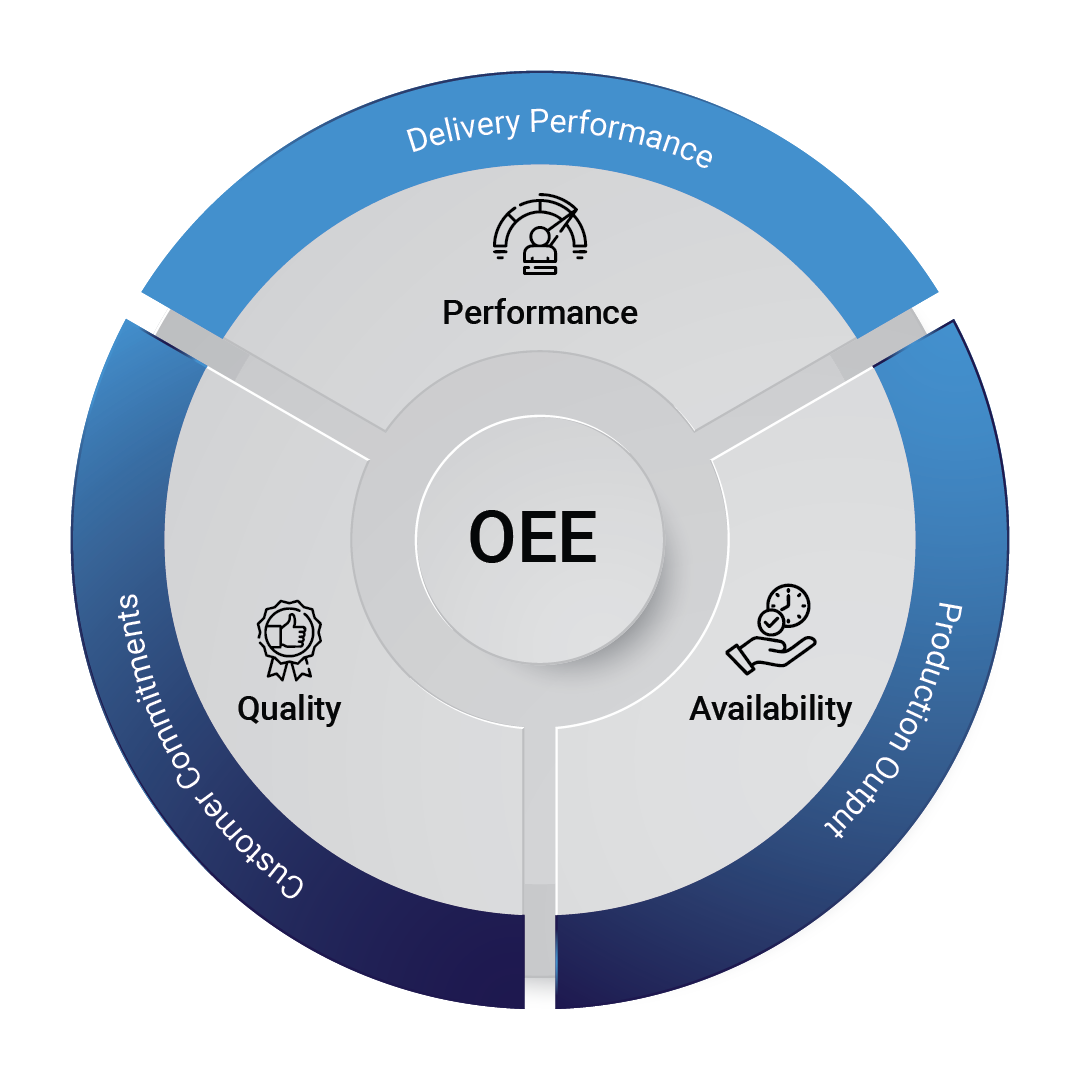
Why OEE is the Most Critical Manufacturing KPI
OEE is often considered the most important manufacturing KPI because it consolidates three critical dimensions of production performance: availability, performance, and quality into a single metric. Unlike standalone production metrics, OEE does not just measure output or efficiency in isolation. It exposes where production losses occur, whether due to machine downtime, speed inefficiencies, or quality defects. This makes OEE a powerful starting point for performance improvement. A drop in OEE immediately signals that something is wrong, but more importantly, it points teams toward where to investigate. However, OEE alone cannot explain everything. For example:
- A low OEE may indicate downtime, but not whether the issue is maintenance-related (MTTR/MTBF)
- It may reflect quality losses, but not the root cause behind scrap or rework (FPY, scrap rate)
- It may show performance loss, but not the exact bottleneck (cycle time, throughput)
Smarter Manufacturing with Smart KPI Tracking
Manufacturing KPIs are essential for achieving operational control and continuous improvement. Among them, OEE remains one of the most important KPIs, providing a comprehensive view of equipment effectiveness. But its real value emerges when it is used alongside other production metrics such as downtime, quality, and delivery performance.
Manufacturing KPIs are not just tools for measurement; they are essential for control, alignment, and continuous improvement. The goal for modern manufacturers is not to track more data but to focus on the metrics that truly matter and use them to drive action on the shop floor.
If your plant is already tracking KPIs but still struggling with downtime, inefficiencies, or inconsistent output, the gap is not data, it’s visibility and action.
Discover how you can monitor KPIs like OEE, downtime, and FPY in real time to enable faster, data-driven decisions on the shop floor
OEE is considered the most important because it combines availability, performance, and quality into a single efficiency metric.
OEE KPI provides a comprehensive view of equipment effectiveness and helps identify hidden production losses.
Top OEE monitoring systems provide real-time visibility into production performance. Key features include the following:
- Real-time machine data collection
- Automated OEE calculation
- Live dashboards
- Downtime tracking
- Root cause analysis
- Alerts for quick action
- Historical trend analysis
- Integration with MES or ERP systems.
To implement OEE dashboards, manufacturers need to capture real-time machine data, define standard KPIs, configure dashboards for visibility, and ensure teams act on insights.
Smart Factories use MOM or MES platforms with real-time data capture, analytics, and integrated dashboards to track production metrics.
In lean manufacturing, KPIs such as cycle time, takt time, OEE, FPY, scrap rate, and on-time delivery are critical. These metrics focus on waste reduction, process efficiency, and consistent output.
Small and mid-sized manufacturers can adopt scalable OEE monitoring solutions that offer cloud-based deployment, easy integration with existing machines, and cost-effective real-time KPI tracking, like Smart Factory MOM.