







Smart Factory

Webinar
45 Minutes
Still Running Production on Paper? How MES Creates Real-Time Shop-Floor Visibility Still Running Production on Paper? How MES Creates Real-Time Shop-Floor Visibility Still Running Production on Paper? How MES Creates Real-Time Shop-Floor Visibility
an advanced guide on how to calculate oee
Summary

OEE stands as the core performance metric for any manufacturing unit; thus, accurate OEE calculation is imperative to understanding true production efficiency. Without it, manufacturers are often left comparing surface-level output numbers that don't account for downtime, slow cycles, or defective units, leaving real performance gaps hidden.

This detailed OEE calculation guide explains the OEE calculation logic and thoroughly defines each OEE factor: availability, performance, and quality. The blog also covers step-by-step OEE calculation process with example, strategies to improve OEE score, and mistakes to avoid for accurate OEE calculation.

OEE (Overall Equipment Effectiveness) is a manufacturing metric that measures how effectively a production asset runs compared to its full potential. OEE calculation brings data-driven precision to manufacturing performance. In every manufacturing unit, OEE metrics enable operators to see if the machinery assets are working to their best capacity and analyze their performance.

Quick OEE Calculation Overview:

OEE = Availability × Performance × Quality

Simple OEE Formula:

OEE = (Good Count x Ideal Cycle Time) % Planned Production Time

Note: A world-class OEE score is typically 85% or higher, though most discrete manufacturers run between 60% and 75%

If you've ever had two shifts hit "the same" production numbers with wildly different downtime, you already know why raw production output data alone doesn't tell the full story. OEE breaks that story into three parts:

  • Is the machine running?
  • Is it running at speed?
  • Is it making good parts?

All these questions help to reveal exactly where the losses are instead of guessing.

This guide covers OEE calculations for both beginners and experts from the core formulas to worked examples and common mistakes to avoid, so you can start applying it to your own production line.

Understand OEE Calculation with Core OEE Formulas

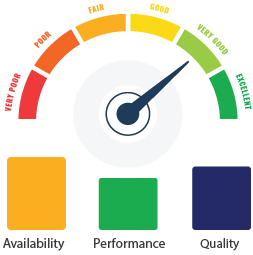
Overall Equipment Effectiveness (OEE) is a key performance metric used in manufacturing. OEE calculations help to assess the efficiency of equipment or processes. OEE combines three factors into one score:

  • How often the equipment runs
  • How fast it runs
  • How much of what it makes is actually good

Each factor points to a different kind of loss, which is why manufacturers track them separately before combining them. OEE is calculated by measuring three crucial factors:

Availability

Availability is the percentage of scheduled production time that equipment is actually running.

In manufacturing, maximizing uptime is essential for achieving peak efficiency and productivity. Availability, a fundamental metric in Overall Equipment Effectiveness (OEE) analysis, measures the percentage of time that equipment is available and ready for production. Minimizing downtime and optimizing equipment availability allows you to unlock significant gains in operations. Learning to calculate Availability is essential before you understand how to calculate overall equipment effectiveness.

The availability calculation formula is:

Availability = (Actual Production Time / Potential Production Time) * 100%

Where,

Planned Production Time: This is the total time that the equipment is scheduled to be available for production. It represents the maximum possible time the equipment could be operating if there were no interruptions.

Planned Production Time = Potential production time – Planned stops

Actual Production Time: This is the actual time the equipment is producing goods, after subtracting any downtime due to planned maintenance and unplanned stops.

Actual Production Time = Planned Production Time – Unplanned Stops

Performance

Performance measures how fast equipment ran compared to its maximum designed speed. It considers factors like machine slowdowns, idling, and minor stoppages. Optimizing speed and quality is essential for operational excellence. Performance is a critical component of Overall Equipment Effectiveness (OEE). By fine-tuning performance, you can achieve higher production rates, reduce cycle times, accurately calculate OEE, and enhance product quality.

The performance calculation formula is:

Performance = (Actual Output / Theoretical Output) * 100%

Quality

Quality measures the ratio of good quality output to total production output. It takes into account defects, rework, and scrap.

Quality is essential for manufacturing excellence. Quality extends insights into product integrity and manufacturing effectiveness. By continuously striving for excellence, you can strengthen your brand reputation, drive customer satisfaction, and achieve sustained success in today's competitive landscape.

The quality calculation formula is:

Quality = Good Unit Output / Total Output * 100%

Once Availability, Performance, and Quality calculations are complete, they are multiplied together to obtain the Overall Equipment Effectiveness (OEE). OEE formula goes as follows:

OEE provides a comprehensive view of equipment performance, allowing manufacturers to identify areas for improvement and implement targeted strategies to enhance efficiency, productivity, and grade. It helps you optimize manufacturing processes, reduce waste, and maximize profitability.

OEE Calculation with Smart Factory MOM

Learn more about OEE capabilities in Smart Factory and explore how OEE dashboards and statistics can help improve production efficiency.

Step by Step OEE Calculation with Example

Understanding the calculation of OEE is crucial for optimizing manufacturing operations and driving efficiency. You can calculate it by combining three key metrics: Availability, Performance, and Quality.

Let's understand the process of calculating OEE with real-time example.

Step 1: Calculate Availability

Availability measures the percentage of time equipment is available for production.

For example,

Let's say a manufacturing facility plans to run a production line for one full shift, which lasts 10 hours or 600 minutes. Throughout, there are three instances of planned maintenance, each lasting 20 minutes, and a total of 70 minutes of unplanned downtime due to equipment breakdowns.

From this scenario, we can identify the following variables:

  • Potential Production Time: 10 hours or 600 minutes
  • Planned Stops: 3 x 20 minutes, totaling 60 minutes
  • Unplanned Stops: 70 minutes

To calculate the Actual Production Time:

  • Actual Production Time = Potential Production Time − Planned Stops − Unplanned Stops
  • Actual Production Time: 600 minutes – 60 minutes – 70 minutes = 470 minutes

Now, to find the Availability:

  • Availability = (Actual Production Time / Potential Production Time) × 100%
  • Availability = (470 minutes / 600 minutes) × 100%
  • Availability = 78.33%

So, the Availability of the production line in this scenario is approximately 78.33%.

Every minute of downtime chips away at output. Tracking Availability accurately is what lets you catch equipment reliability issues before they become bigger disruptions.

Step 2: Calculate Performance

Performance evaluates how well equipment performs compared to its maximum potential speed.

For example,

Suppose a manufacturing machine has an Ideal Cycle Time of 20 seconds, allowing it to produce 3 units per minute. Over a production period of 240 minutes of actual production time, the machine successfully manufactures 650 units.

Here are the variables:

  • Ideal Cycle Time: 20 seconds
  • Actual Production Time: 240 minutes
  • Actual Output: 650 units

To calculate Theoretical Output:

  • Theoretical Output = Actual Production Time / Ideal Cycle Time
  • Theoretical Output = 240 minutes × 60 seconds / 20 seconds per unit = 720 units

Now, to find Performance:

  • Performance = (Actual Output / Theoretical Output) × 100%
  • Performance = (650 units / 720 units) × 100%
  • Performance = 90.28%

In this scenario, the performance of the manufacturing machine is approximately 90.28%.

Step 3: Calculate Quality

Quality measures the ratio of good units produced to total output.

For example, during a production shift, a manufacturing line produces a total of 650 units. After inspection, it was found that 30 units were defective and declared as rejects.

From this information, we can identify:

  • Total Output during the shift: 650 units
  • Good Unit Output: The actual number of good parts produced is 650 – 30, so 620 units

To calculate Quality:

  • Quality = Good Unit Output / Total Output × 100%
  • Quality = 620 units / 650 units × 100%
  • Quality = 94.67%

So, the quality of production in this scenario is approximately 94.67%.

Step 4: Convert Percentages to Decimals

Since we cannot multiply percentages directly, convert them to decimals.

  • Availability in decimal form: 0.7833
  • Performance in decimal form: 0.9028
  • Quality in decimal form: 0.9467

Step 5: Calculate OEE

Multiply Availability, Performance, and Quality to obtain OEE.

OEE = 0.7833 × 0.9028 × 0.9467 × 100%

OEE = 66.70%

Step 6: OEE Result Analysis

For the OEE result analysis, first it is important to understand:

What does a good or bad OEE score mean?

A higher OEE percentage means less downtime, faster cycles, and fewer defects. What counts as "good" depends on your equipment, industry, and product complexity, so it's worth tracking your own OEE over time rather than chasing a single universal number.

Verdict: An OEE score above 85% is considered world-class. Most discrete manufacturers score between 60% and 75%. A score below 60% signals significant, addressable losses in availability, performance, or quality.

Example Analysis

In this worked example, OEE comes out to 66.70%.

In this example, the company has a significant gap from the target OEE. The most critical area of opportunity is availability, which is the lowest value and negatively impacts the OEE calculation. This low availability reduces overall effectiveness, even though the other pillars (performance and quality) are above 90%, surpassing world-class industry targets.

What do the results say?

The calculations using the formula for OEE provide results that indicate and shed light on different aspects of equipment performance and production quality. A higher OEE percentage signifies better overall equipment effectiveness. It shows that the equipment operates efficiently, with minimal downtime, optimal speed, and high-quality output.

The results and interpretation vary in the context of industry standards and specific production goals. OEE can vary according to the equipment design, maintenance practices, and product complexity. You can analyze the calculation of OEE results over time and compare them to benchmarks. You can identify opportunities for improvement and implement strategies to enhance operational efficiency and productivity. Customizing the needs and wants of your industry is the finest way to achieve desirable results with the help of OEE.

Examine your Equipment Performance, Try our Advanced OEE Calculator

Now that you've learned how to calculate OEE, why not practice a little?

Use our interactive OEE calculator, which allows you to simulate real-life production scenarios and understand how availability, throughput, and quality impact your efficiency.

OEE vs. TEEP vs. The Simple OEE Formula

Metric Measures Best for

OEE

Effectiveness during planned production time

Standard shop-floor tracking

TEEP

Effectiveness against all available time (24/7/365)

Capacity planning

Simple OEE formula

Quick estimate using Good Count and Ideal Cycle Time

Fast, low-data situations

Best for most manufacturers: OEE is the standard metric to track day-to-day, since it measures effectiveness within planned production time rather than total calendar time.

TEEP Calculation Formula

TEEP = OEE × Loading

It is more useful when evaluating unused capacity.

Top Mistakes to Avoid for Accurate OEE Calculation

Some of the common mistakes that any manufacturing organization can make when calculating OEE are as follows:

  • Manual Data Collection

    Manual data logging is a common source of missed or inaccurate OEE readings. Manual data collection leads to insufficient or poor data results. Manual logs miss things: a reading skipped mid-shift, a number written down wrong. Those small gaps compound into an OEE score that doesn't hold up to scrutiny.

  • Inaccurate Equipment Run Speed

    You may find managers or supervisors in a manufacturing organization using scheduled or average equipment speed instead of the rated speed for OEE calculation. Using the machine's scheduled speed instead of its true rated speed is an easy way to inflate the score, and it buries the exact improvement opportunities OEE is supposed to surface.

  • Paying Less Attention to All Production Stops

    A manufacturing organization should be able to evaluate accurately the difference between the planned and unplanned stops to calculate OEE effectively. Mislabeling unplanned stops as planned hides real downtime from the OEE calculation. It’s important to acknowledge unplanned stops and try to find the root cause to avoid such stops in the future.

  • Inconsistent OEE Calculation

    Standardization is essential when calculating OEE across plants in different geographies. Inconsistent OEE definitions across plants make cross-site comparisons meaningless. If each plant defines downtime differently, OEE numbers can't be compared across sites. Centralizing data collection and using one shared definition fixes this. Consistent usage of data, methods, and approach ensures accurate OEE calculation and leads to effective communication across the organization.

  • Short Time Period for Calculation

    Choosing a short time period, such as a single day shift, for OEE calculation leads to inaccurate results that should not form the basis for analysis and improvement. A single shift is too small a sample to reflect true OEE performance. It is important to gather sufficient data over a longer period of time, such as a month or 3 months, to take into account the productivity peaks and downtime.

What data do I need to calculate OEE accurately?

Data collection is the cornerstone of Overall Equipment Effectiveness (OEE) analysis. Precise and accurate data collection are the essential building blocks for understanding equipment performance and identifying opportunities for improvement. It allows for perfect overall equipment efficiency calculation. OEE is only as reliable as the data behind it. These are the data points worth getting right:

  • Capture essential production data such as start and stop times, downtime events, production counts, and any relevant parameters specific to the equipment or process.
  • Utilize real-time monitoring systems for continuous collection of data throughout the production process. It offers immediate detection of issues and empowers operators to take timely actions.
  • Accurately tracking downtime events is critical for assessing equipment availability. It allows for proper log creation for log time and ensures nothing goes missing.
  • Monitoring equipment performance involves tracking production rates, cycle times, and efficiency metrics. It allows for a quick detection of deviation from expected production rates.
  • Collecting quality data involves tracking the number of acceptable and defective units produced during a given period. This data enables accurate OEE calculation and improves insights.
  • Integrating data collection systems with OEE software platforms is effective. It automates data capture, consolidates information, and provides reports for performance monitoring and analysis.
Optimize Your Production Process With Our Production Module

Ready to take your production process to the next level? Our Production module provides real-time insights into your production process, enabling you to optimize resource utilization, reduce costs, and increase efficiency. Don’t let production bottlenecks and manual tasks slow you down.

How to Improve OEE in Manufacturing

Using an overall equipment effectiveness calculator is never enough. Implementing OEE improvement strategies is essential for maximizing operational efficiency and driving continuous improvement in manufacturing processes. Here are some effective OEE implementation strategies:

  • Define Clear Objectives

    Define the goals and objectives of implementing OEE within your organization. It includes reducing downtime and waste, increasing throughput and quality, and so on. Having clear objectives will guide your OEE implementation efforts.

  • Invest in Technology

    Utilize advanced technology solutions such as OEE calculator software and real-time monitoring to collect, analyze, and visualize data.
    They enable proactive decision-making and timely intervention to address issues.

  • Standardize Processes

    Standardize operating procedures and maintenance practices to minimize variability and optimize equipment performance. It helps ensure consistency and reliability in production operations.

  • Provide Training and Education

    Ensure that employees understand the concept of OEE and its importance in improving efficiency. Provide training sessions and educational materials to empower staff with overall equipment effectiveness formula and strategies.

  • Implement Lean Manufacturing Principles

    Incorporate lean manufacturing principles to eliminate waste, reduce setup times, and improve overall equipment effectiveness. They complement OEE by fostering a culture of continuous progress and efficiency.

  • Set Key Performance Indicators (KPIs)

    Define key performance indicators aligned with OEE goals and regularly monitor progress. They provide valuable insights into equipment performance and help track improvements over time.

  • Encourage Cross-Functional Collaboration

    Foster collaboration between different departments to identify root causes of inefficiencies. Cross-functional teams can leverage their expertise to drive OEE improvements holistically across the organization.

  • Constant Monitoring and Improvement

    Implement a culture of continuous monitoring and improvement. Regularly review, analyze, and act on changes. Encourage feedback and conduct brainstorming sessions for OEE optimization.

By implementing these strategies, organizations can unlock the full potential of Overall Equipment Effectiveness (OEE). It helps you drive sustainable improvements in operational efficiency, productivity, and profitability. With the knowledge of how to calculate OEE and strategies for post-result analysis, you will always stay ahead on the road of improvement and industrial competition.

Key takeaway:

Calculating OEE accurately comes down to consistent data, the same definitions of downtime, the same cycle time assumptions, shift after shift. Get that right, and OEE stops being a report card and starts being a tool you actually use to find where production time is disappearing.

Book your demo today to see Smart Factory MOM in action and witness the power of OEE functionalities to identify production losses, leading to improved quality and efficiency in production processes.

FAQ

A world-class OEE score is typically considered 85% or higher, though most discrete manufacturers run between 60% and 75%.

The Six Big Losses are breakdowns, setup and adjustment, small stops, reduced speed, process defects, and reduced yield. They fall under Availability, Performance, and Quality.

OEE should be calculated per shift or daily for accurate trend tracking and for maximizing production efficiency.

No. Productivity can be influenced by labor and planning decisions, while OEE measures equipment performance specifically.

OEE measures effectiveness during planned production time, while TEEP measures effectiveness against all available time, including time the plant is not scheduled to run.