


Real-time manufacturing dashboards transform how production teams monitor, manage, and improve shop-floor operations by converting raw machine data, quality metrics, and ERP information into live visual intelligence. This article explores what these dashboards are, why they have become essential in today's lean and fast-paced manufacturing environment, and the five key types, each designed for specific role and decision-making needs. It also provides a practical four-step implementation framework covering objective setting, platform selection, data integration, and audience-centric design.
Navigate to section

- 1. What is Line Balancing in Manufacturing?
- 2. Line Balancing Methods: Manual Heuristics vs. Algorithm-Assisted Scheduling
- 3. Understand the Key Line Balancing Terms and Formulas
- 4. How to Balance a Production Line: Step-by-Step Approach
- 5. Benefits of Line Balancing in Manufacturing: How it Affects Production Bottom Line
- 6. Line Balancing with Smart Factory Scheduling Software
- 7. Standard Line Balancing for Maximizing Production Efficiency
With hefty production going on in any manufacturing unit, it is obvious for the assembly lines to deal with the imbalance challenges. One station may have two or three operators working at full speed and are still falling behind, whereas one station is facing delay due to unavailability of the material or machine parts and operators are standing idle.
That idle operator is still on the clock. That overloaded station sets a ceiling on what the rest of the line can produce, regardless of how well every other station performs. And the downstream effects, work-in-process piling up between stations, missed ship dates, quality problems caused by rushed work, repeat every shift until someone intervenes. That’s where the Line Balancing strategy comes into consideration.
Line balancing is the process of distributing work evenly across every workstation on a production line, so no single station becomes a bottleneck or sits idle.
- Get it right, and the line moves at a steady, predictable pace.
- Get it wrong, and one overloaded station quietly sets a ceiling on everything downstream, while idle capacity elsewhere keeps drawing payroll without adding output.
This guide covers the formulas and methods used to balance a line, the step-by-step process for doing it, the reasons manual balancing efforts usually stop holding up after a few months, and how scheduling software keeps a line balanced once demand or product mix starts moving around. Line balancing is one of the structural foundations that makes production scheduling predictable: without it, even a well-built schedule will consistently underperform.
What is Line Balancing in Manufacturing?
Line balancing is the practice of optimizing task assignments across a production line to ensure that work is distributed evenly among all stations. The goal is for each station to complete its assigned tasks within the available cycle time, enabling products to move through the line without interruption.
Effective line balancing reduces bottlenecks, eliminates unnecessary idle time, and helps maximize throughput, productivity, and overall manufacturing efficiency. The reference point for any line balancing exercise is takt time calculation. The metrics that help to identify and diagnose an imbalance line are: cycle time, takt time, and lead time.
It's calculated as:
"Takt Time = Available Production Time ÷ Customer Demand"
If a plant runs 480 minutes per shift and demand calls for 60 units, takt time is 8 minutes per unit. Every workstation needs to complete its assigned work inside that window.
A station that takes 9.5 minutes is the bottleneck; it's the reason the whole line slows down.
A station that takes 4.5 minutes has spare capacity that could take work from somewhere else.
Line balancing applies across manufacturing types: high-volume discrete assembly, mixed-model lines running multiple variants, and process manufacturing environments, where the challenge shifts from individual task assignment to aligning batch durations and equipment utilization.
Understand how Smart Factory MOM scheduling helps with line balancing in real-time with its advanced features. Explore how scheduling works, what it tracks and how it impacts the production efficiency.
Line Balancing Methods: Manual Heuristics vs. Algorithm-Assisted Scheduling
There are multiple methods and strategies to achieve Line balancing in manufacturing. The techniques range from heuristics you can run in a spreadsheet to optimization algorithms that adjust in real time. The selection of the strategy depends on line complexity, data quality, and the frequency of product mix changes.
-
Largest Candidate Rule (LCR)
LCR is the simplest line balancing approach, where tasks are assigned to workstations in descending order of task time, respecting priority, until you hit takt time, and then you open the next station. It's fast and easy to explain to a floor team, but on anything more complex than a small, stable line, it leaves real efficiency on the table.
-
Ranked Positional Weight (RPW) or Helgeson-Birnie Method
Most industrial engineers highly prefer the RPW line balancing method. Each task is ranked by its positional weight, its own time, plus the time of every downstream task that depends on it. The highest-weight tasks are assigned first, on the logic that a delay there has the biggest ripple effect.
-
Kilbridge and Wester (Column Method)
Kilbridge and Wester, or the column method, group tasks by column position in the precedence diagram. Tasks with no predecessors' form column one, tasks depending only on column one form column two, and so on. It tends to handle high-mix environments more intuitively than RPW, but it leans hard on having a well-built precedence diagram to start from.
-
Simulation-Based Balancing
For mixed-model lines running multiple variants with different sequences and times, discrete-event simulation lets you test rebalancing scenarios before touching the floor.
For example, moving a task from Station 4 to Station 3, say, and checking the effect across every product variant and demand mix before a single workstation gets physically rearranged. The setup cost is higher, but on a complex line, it pays for itself the first time it prevents a failed rebalancing attempt.
-
APS-Driven Dynamic Balancing
Advanced Planning and Scheduling software takes a different approach entirely: instead of balancing a line once and hoping it holds, APS continuously checks work center loading against live demand, capacity constraints, operator availability, and routing data and then reoptimizes assignments as conditions change. On a line where Monday's mix looks nothing like Thursday's, this is the only approach that keeps up.
Comparison of Line Balancing Methods
| Method | Complexity | Best For | Tool Required |
|---|---|---|---|
Largest Candidate Rule |
Low |
Small, stable lines |
Manual |
Ranked Positional Weight |
Medium |
Mid-size assembly lines |
Manual or software |
Kilbridge & Wester |
Medium |
High-mix, complex precedence |
Manual or software |
Simulation-based |
High |
Mixed-model, multi-variant |
Software |
APS-driven (dynamic) |
Very High |
Any line with changing demand |
Smart factory software |
Understand the Key Line Balancing Terms and Formulas
Before getting into line balancing execution steps, let’s first understand each term and formula used in the process. These are the terms industrial engineers use when analyzing a line.
-
Takt Time
Takt time calculation is the foundation of line balancing. Takt time is the pace the line has to hit to meet demand, not a target to beat but a constraint to design around. Running faster than takt time at some stations doesn't help if another station can't keep up.
-
Cycle Time
The actual time a workstation takes to finish its assigned tasks on one unit. The goal is for every station's cycle time to sit at or below takt time. Once cycle time exceeds takt time at any station, that station is the bottleneck.
-
Line Efficiency (Balance Efficiency)
The headline metric for a line balancing analysis:
Line Efficiency = (Sum of All Task Times) ÷ (Number of Workstations × Takt Time) × 100
-
Balance Delay
The inverse of line efficiency, the share of available time lost to idle stations or waiting between tasks. At 75% line efficiency, balance delay is 25%. That's the real capacity you're paying for and not using.
-
Precedence Constraints
Not every task can be assigned to any station. Some operations have to happen before others; you can't weld an assembly before it's been cut and fitted. These relationships set the real boundaries on what any balancing method can achieve. A solid precedence diagram is the foundation of the whole exercise.
-
Work-in-Process (WIP)
Inventory sitting between workstations. High WIP is both a symptom and a consequence of imbalance, and one of the clearest visual signals that a line needs attention.
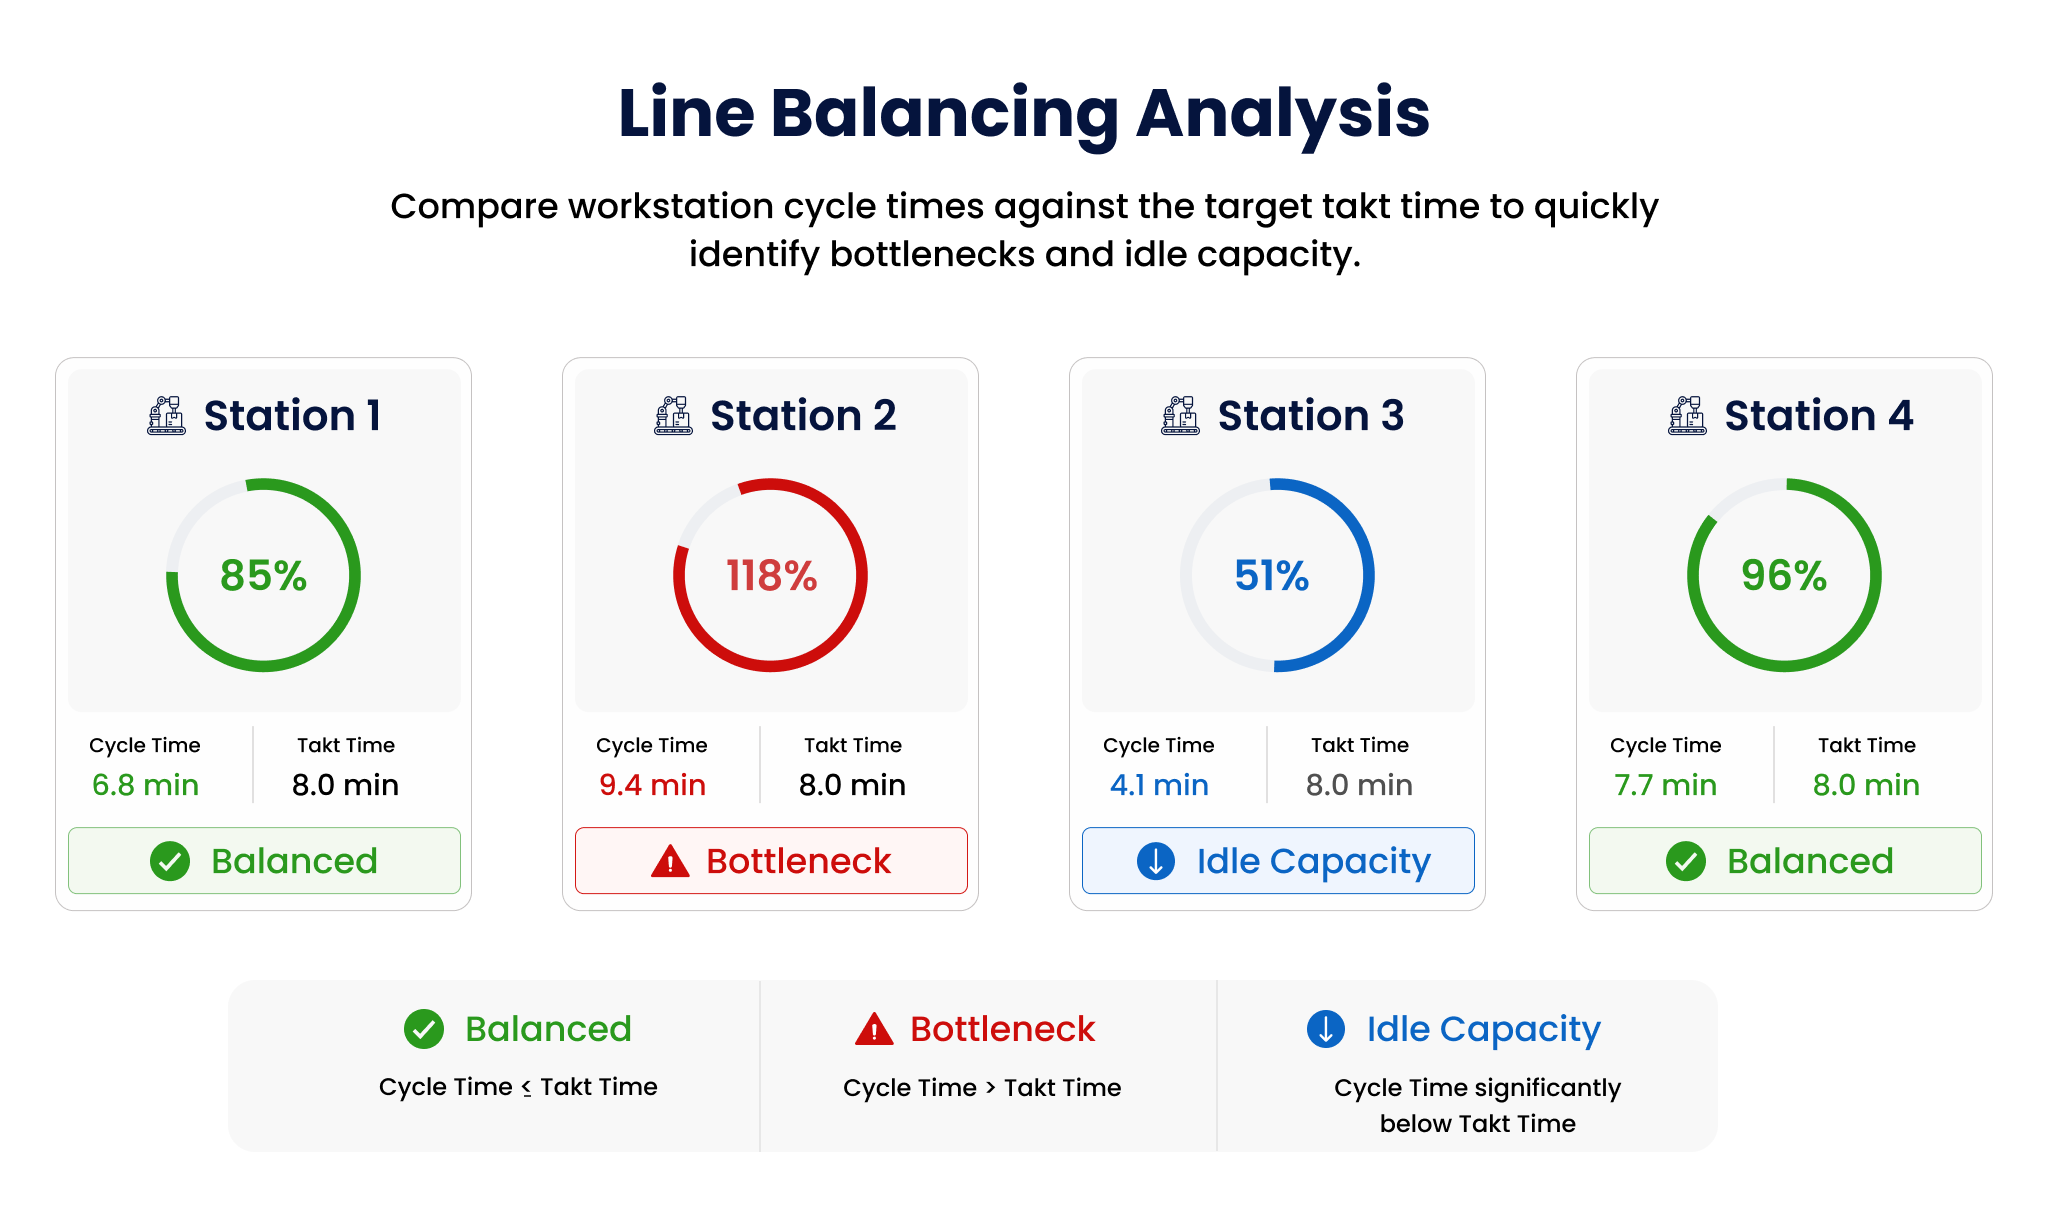
This type of analysis can typically be completed in about an hour and quickly highlights the workstations that require attention, making it easier to identify bottlenecks and opportunities for improved line balance.
How to Balance a Production Line: Step-by-Step Approach
Line balancing isn't as complicated a concept as it may seem if executed with clarity and the right approach. It gets complicated when data is missing; constraints aren't well understood, or there's no structured process behind it.
Here's the step-by-step approach to achieve line balancing in manufacturing:
-
Define Customer Demand and Calculate Takt Time
This is the starting point for everything that follows. Pull your available production time (shift hours minus scheduled breaks) and current customer demand, then calculate takt time. Every decision downstream gets measured against it.
-
Map and Time Every Task Element
Break the process into its smallest repeatable elements and get a measured time for each one, not an estimate. Run time studies or pull the data from your MES software or shop floor execution system if you have one. This is the step where most manual balancing efforts fall apart, because the data either doesn't exist or isn't trusted.
-
Build the Precedence Diagram
Identify and map out which tasks have to happen before others, including physical constraints and quality-driven sequencing like inspection following welding. The precedence diagram tells you which task reassignments are actually feasible.
-
Identify Bottlenecks and Idle Stations
Compare actual cycle time at each station against takt time. Any station operating above takt time constrains the whole line's output. Any station meaningfully below takt time has spare capacity that could absorb work from elsewhere. A simple bar chart of cycle time vs. takt time makes this obvious immediately.
-
Assign Tasks to Workstations
Use a suitable line-balancing method and redistribute task elements so that every station falls within takt time. Document the new assignment and confirm precedence constraints still hold in the new configuration.
-
Calculate Line Efficiency and Balance Delay
Run the numbers before changing anything on the floor. Moving from 71% to 89% efficiency is worth implementing. Moving from 71% to 74% probably means there's a constraint you haven't fully addressed yet.
-
Pilot and Adjust
Run the rebalanced configuration at a reduced pace first, capture actual cycle times, and compare them against the model. Real-world variation, operators getting used to a new sequence, physical constraints nobody flagged, and equipment quirks will create gaps between the model and reality. Plan to adjust quickly rather than the perfect first attempt.
-
Monitor Continuously with Live Shop Floor Data
Line balance isn't a one-time project. Demand shifts, operators change; new variants get added. A line that's 91% efficient today can drift to 74% over six months without anyone tracking it. Feeding actual cycle time data back into your scheduling model is what surfaces imbalance before it turns into a delivery problem.
Benefits of Line Balancing in Manufacturing: How it Affects Production Bottom Line
Line balancing improves production efficiency in many ways. For a manufacturing unit, it is important to run line balancing analysis to identify the bottlenecks and idle capacity. The cost of an unbalanced line is usually higher than people assume until someone actually measures it.. Let’s understand line balancing benefits in detail:
Lower Idle Labor Cost
Labor is one of the largest and highest controllable costs on a production floor, and every minute an operator spends waiting on an upstream station is a minute of payroll producing nothing. When work is distributed evenly, you stop paying for time that produces nothing, and on an eight-station line, two idle stations add fast over a shift.
Less Work-in-Process Buildup and Hidden Quality Risk
When one station runs faster than the next, work-in-process inventory stacks between them. That WIP eats floor space, requires extra handling, and carries risk. When stations run at similar cycle times, inventory doesn't pile up between them. That matters beyond floor space: an early defect gets caught sooner, rather than sitting hidden in a growing buffer until it surfaces three stations later.
Predictable Lead Times and On-Time Delivery
Bottlenecks compress effective lead time in ways that are hard to predict at the scheduling stage. A line without a hidden bottleneck approaches its theoretical capacity. This results in less expediting, fewer overtime premiums, and fewer awkward calls to customers about a shipment date.
No Operator Pressure and Quality Defects
Operators at an overloaded station aren't being careless; they're rushing because the line is forcing the pace. Rushed work produces more errors, more rework, and more scrap. Line balancing takes the pressure off, and rework and scrap rates tend to drop with it and OEE analytics improves.
Scaling Production Efficiently
A balanced line absorbs a new variant or higher volume without the existing bottleneck becoming a significant overhead. It is feasible to scale the production if each station is already following the right line balancing approach.
Line Balancing with Smart Factory Scheduling Software
Real-time cycle time data collection from the shop floor removes the task time measurement dependency that delays most manual efforts. APS-driven scheduling detects balance drift as demand shifts and automatically re-optimizes work center loading. Constraint-based scheduling accounts for operator skills, machine availability, and changeover sequences, not just idealized task times.
How Smart Factory MOM Keeps Production Lines Balanced
Manual line balancing, even done well, produces a point-in-time answer to a question that keeps changing. The moment demand shifts, a new product enters the mix, or an operator calls out; the balance you worked to achieve starts drifting. If catching that drift depends on someone noticing it and raising it in a weekly planning meeting, you're always reacting to a problem that's already compounded.
Real-time capacity visibility
APS captures actual cycle times from the shop floor continuously. When Station 4 starts running 12% over takt time on a Tuesday afternoon, a material issue, an operator change, a subtle process drift, the system surfaces it before Wednesday morning's production meeting, instead of you finding out through a missed shipment.
APS-driven work center optimization
The Advanced Planning and Scheduling module evaluates capacity against demand, constraints, and routing continuously, not on a weekly cycle. When demand moves from 60 units to 72 mid-week, the system recalculates the required takt time and flags which work centers need rebalancing to hit it before the gap shows up as a missed target.
Constraint-based scheduling
A scheduling model that ignores operator skills, machine OEE, and changeover sequences is bound to fail in practice. The Smart Factory MOM scheduling engine works from real constraints, so the work center loading it recommends is achievable by the actual crew on the actual equipment, not an idealized version of the floor.
IIoT Integration
When machines are connected through IIoT solutions, OEE data, manufacturing downtime events, and actual cycle times feed into the scheduling model automatically, so the system keeps learning from what's actually happening on the floor rather than from assumptions baked in when the model was built.
Standard Line Balancing for Maximizing Production Efficiency
Understanding how to balance a production line is the foundation. Connecting that foundation to a live scheduling and execution system is what makes the improvement durable. The manufacturers who keep their gains are the ones who treat line balancing as an ongoing operational practice rather than a project that wraps up once the report is filed.
A one-time line balancing exercise will improve your production output significantly. Whether the improvement depends on the discipline to regularly measure it, a scheduling system that catches drift before it compounds, and the ability to re-optimize quickly when demand changes, line balancing is the right approach to evenly distribute the work across stations.
A balanced line today can drift back to inefficiency by next quarter, not because of a single decision, but because demand shifted, operators rotated, and nobody was tracking it. We’ll show you exactly how real-time cycle time data, APS scheduling, and work center visibility work together on the platform
Most engineers target 85–95%. Below 80% usually points to a real rebalancing opportunity. Above 95% leaves very little buffer for normal variation and can make the line fragile under any disruption.
Line balancing is structural, which tasks go to which station. Scheduling is operational, determining when and in what sequence to run production. A well-balanced line makes scheduling more predictable, and a good scheduling system helps maintain that balance by catching drift.
Yes, though the mechanics shift from discrete task assignment to aligning batch durations with equipment utilization. The core principle of matching throughput to takt time applies the same way.
Time study software and spreadsheets handle the initial analysis and precedence diagramming. For ongoing balancing on lines where the mix changes often, APS software provides the real-time visibility, and constraint-based optimization manual methods can’t sustain on their own.
Available production time ÷ customer demand. A plant running 480 minutes against demand for 60 units has a takt time of 8 minutes per unit.