


Real-time manufacturing dashboards transform how production teams monitor, manage, and improve shop-floor operations by converting raw machine data, quality metrics, and ERP information into live visual intelligence. This article explores what these dashboards are, why they have become essential in today's lean and fast-paced manufacturing environment, and the six key types, each designed for specific role and decision-making needs. It also provides a practical four-step implementation framework covering objective setting, platform selection, data integration, and audience-centric design.
Navigate to section
- 1. What is Real-Time Manufacturing Dashboard?
- 2. Why Live Production Monitoring Important in Manufacturing
- 3. Types of Real-Time Manufacturing Dashboard
- 4. How to Set Up Real-Time Manufacturing Dashboards
- 5. Benefits of Real-Time Manufacturing Dashboards
- 6. The Role of MES in Real-Time Manufacturing Dashboards
- 7. Conclusion
Imagine walking onto your shop floor and knowing exactly how every machine, line, and operator is performing, not from yesterday's report, but from data that refreshed seconds ago. Manufacturing dashboards are precisely built for real-time data monitoring and analysis and have become one of the most impactful tools in modern manufacturing. No more waiting for end-of-shift summaries and discovering problems hours after they started.
What is a real-time manufacturing dashboard?
A real-time manufacturing dashboard is a live visual interface that consolidates production data from machines, operators, quality systems, and ERP platforms into a single display that updates continuously as operations run. Unlike shift reports or end-of-day summaries, it shows you what is happening on your shop floor right now.
When a line slows down, a quality trend starts drifting, or a machine begins showing early signs of failure, catching it in seconds versus catching it in hours can mean the difference between a minor correction and a costly shutdown. For most manufacturers, that distinction matters more than it sounds. According to McKinsey’s manufacturing report, real-time production monitoring helps manufacturers with around a 20% increase in productivity.
This guide covers everything you need to know about real-time manufacturing dashboards: what they are, the types available, how to set them up, how they integrate with MES and ERP systems, and the measurable benefits they deliver on the shop floor.
What is the Real-Time Manufacturing Dashboard?
A real-time manufacturing dashboard is more than a screen with numbers. It is a continuously updated operational intelligence layer that sits between your shop floor equipment and the people who make decisions about it, pulling raw data from machines, operators, quality checkpoints, and inventory systems, converting it into meaningful production metrics, and displaying those metrics visually the moment they change.
The "real-time" part is the operative word. In a connected factory, data streams directly from PLCs, CNC controllers, IoT sensors, and operator inputs through industrial protocols like OPC-UA and MTConnect. That data is processed and displayed within seconds, giving everyone from a machine operator to a VP of Operations access to the same current picture.
Unlike a shift report or an end-of-day summary, a real-time dashboard does not capture a moment in time and move on. It provides a permanent window into current operations, one that reflects every machine cycle completed, every defect logged, and every downtime event started or resolved as it happens. The difference between the two is not just speed. It is the difference between managing a production floor from memory and managing it from fact.
Real-time manufacturing dashboard typically tracks overall shop-floor performance:
- Overall Equipment Effectiveness (OEE) : Availability, Performance, and Quality
- Performance Metrics: Throughput rates, actual versus planned output, cycle times, takt time adherence, scrap and first-pass yield, downtime by cause, and work-in-progress (WIP) levels
- Operational Status: Maintenance alerts, labor utilization, and supplier delivery status
- Everything is presented through charts, gauges, color-coded status indicators, and trend lines so that patterns and anomalies are immediately visible
Why Live Production Monitoring is Important in Manufacturing
Modern manufacturing operates under pressures that make delayed information a genuine competitive disadvantage. Lean manufacturing initiatives have stripped buffer inventory to minimal levels. Customer demand has become more volatile, with shorter lead times and higher customization expectations. Supply chains remain fragile, and skilled labor is harder to retain. In this environment, the ability to see, understand, and respond to shop-floor events in real time is not a luxury; it is a necessity.
Consider the cost of delayed information:
- A production line stoppage that goes unnoticed for thirty minutes might cascade into missed deliveries, expedited shipping costs, and contractual penalties
- A quality drift that is only caught at final inspection means hours of rework or scrap. An underperforming shift that is only identified at shift change means an entire day's lost capacity
- Manufacturing dashboards compresses the time between problem occurrence and problem awareness from hours to seconds.
Beyond operational efficiency, dashboards play a critical cultural role. When production metrics are visible to everyone on the shop floor, displayed on large screens, and accessible on tablets and mobile devices, they create a shared understanding of goals and performance. Operators can see how their output contributes to the bigger picture. Teams develop a sense of ownership over their metrics. This transparency fosters a data-driven culture where decisions are grounded in evidence rather than hierarchy or habit.
Smart Factory MOM Analytics turns shop floor data into live dashboards, so you can spot issues and act before they slow down production.
6 Types of Real-Time Manufacturing Dashboard
Not all manufacturing dashboards serve the same purpose. A manufacturing production unit involves different data categories, and depending on the criteria, different dashboards are created. Here are the six core dashboard types you should expect from any serious platform.
1. Operational Overview Dashboard
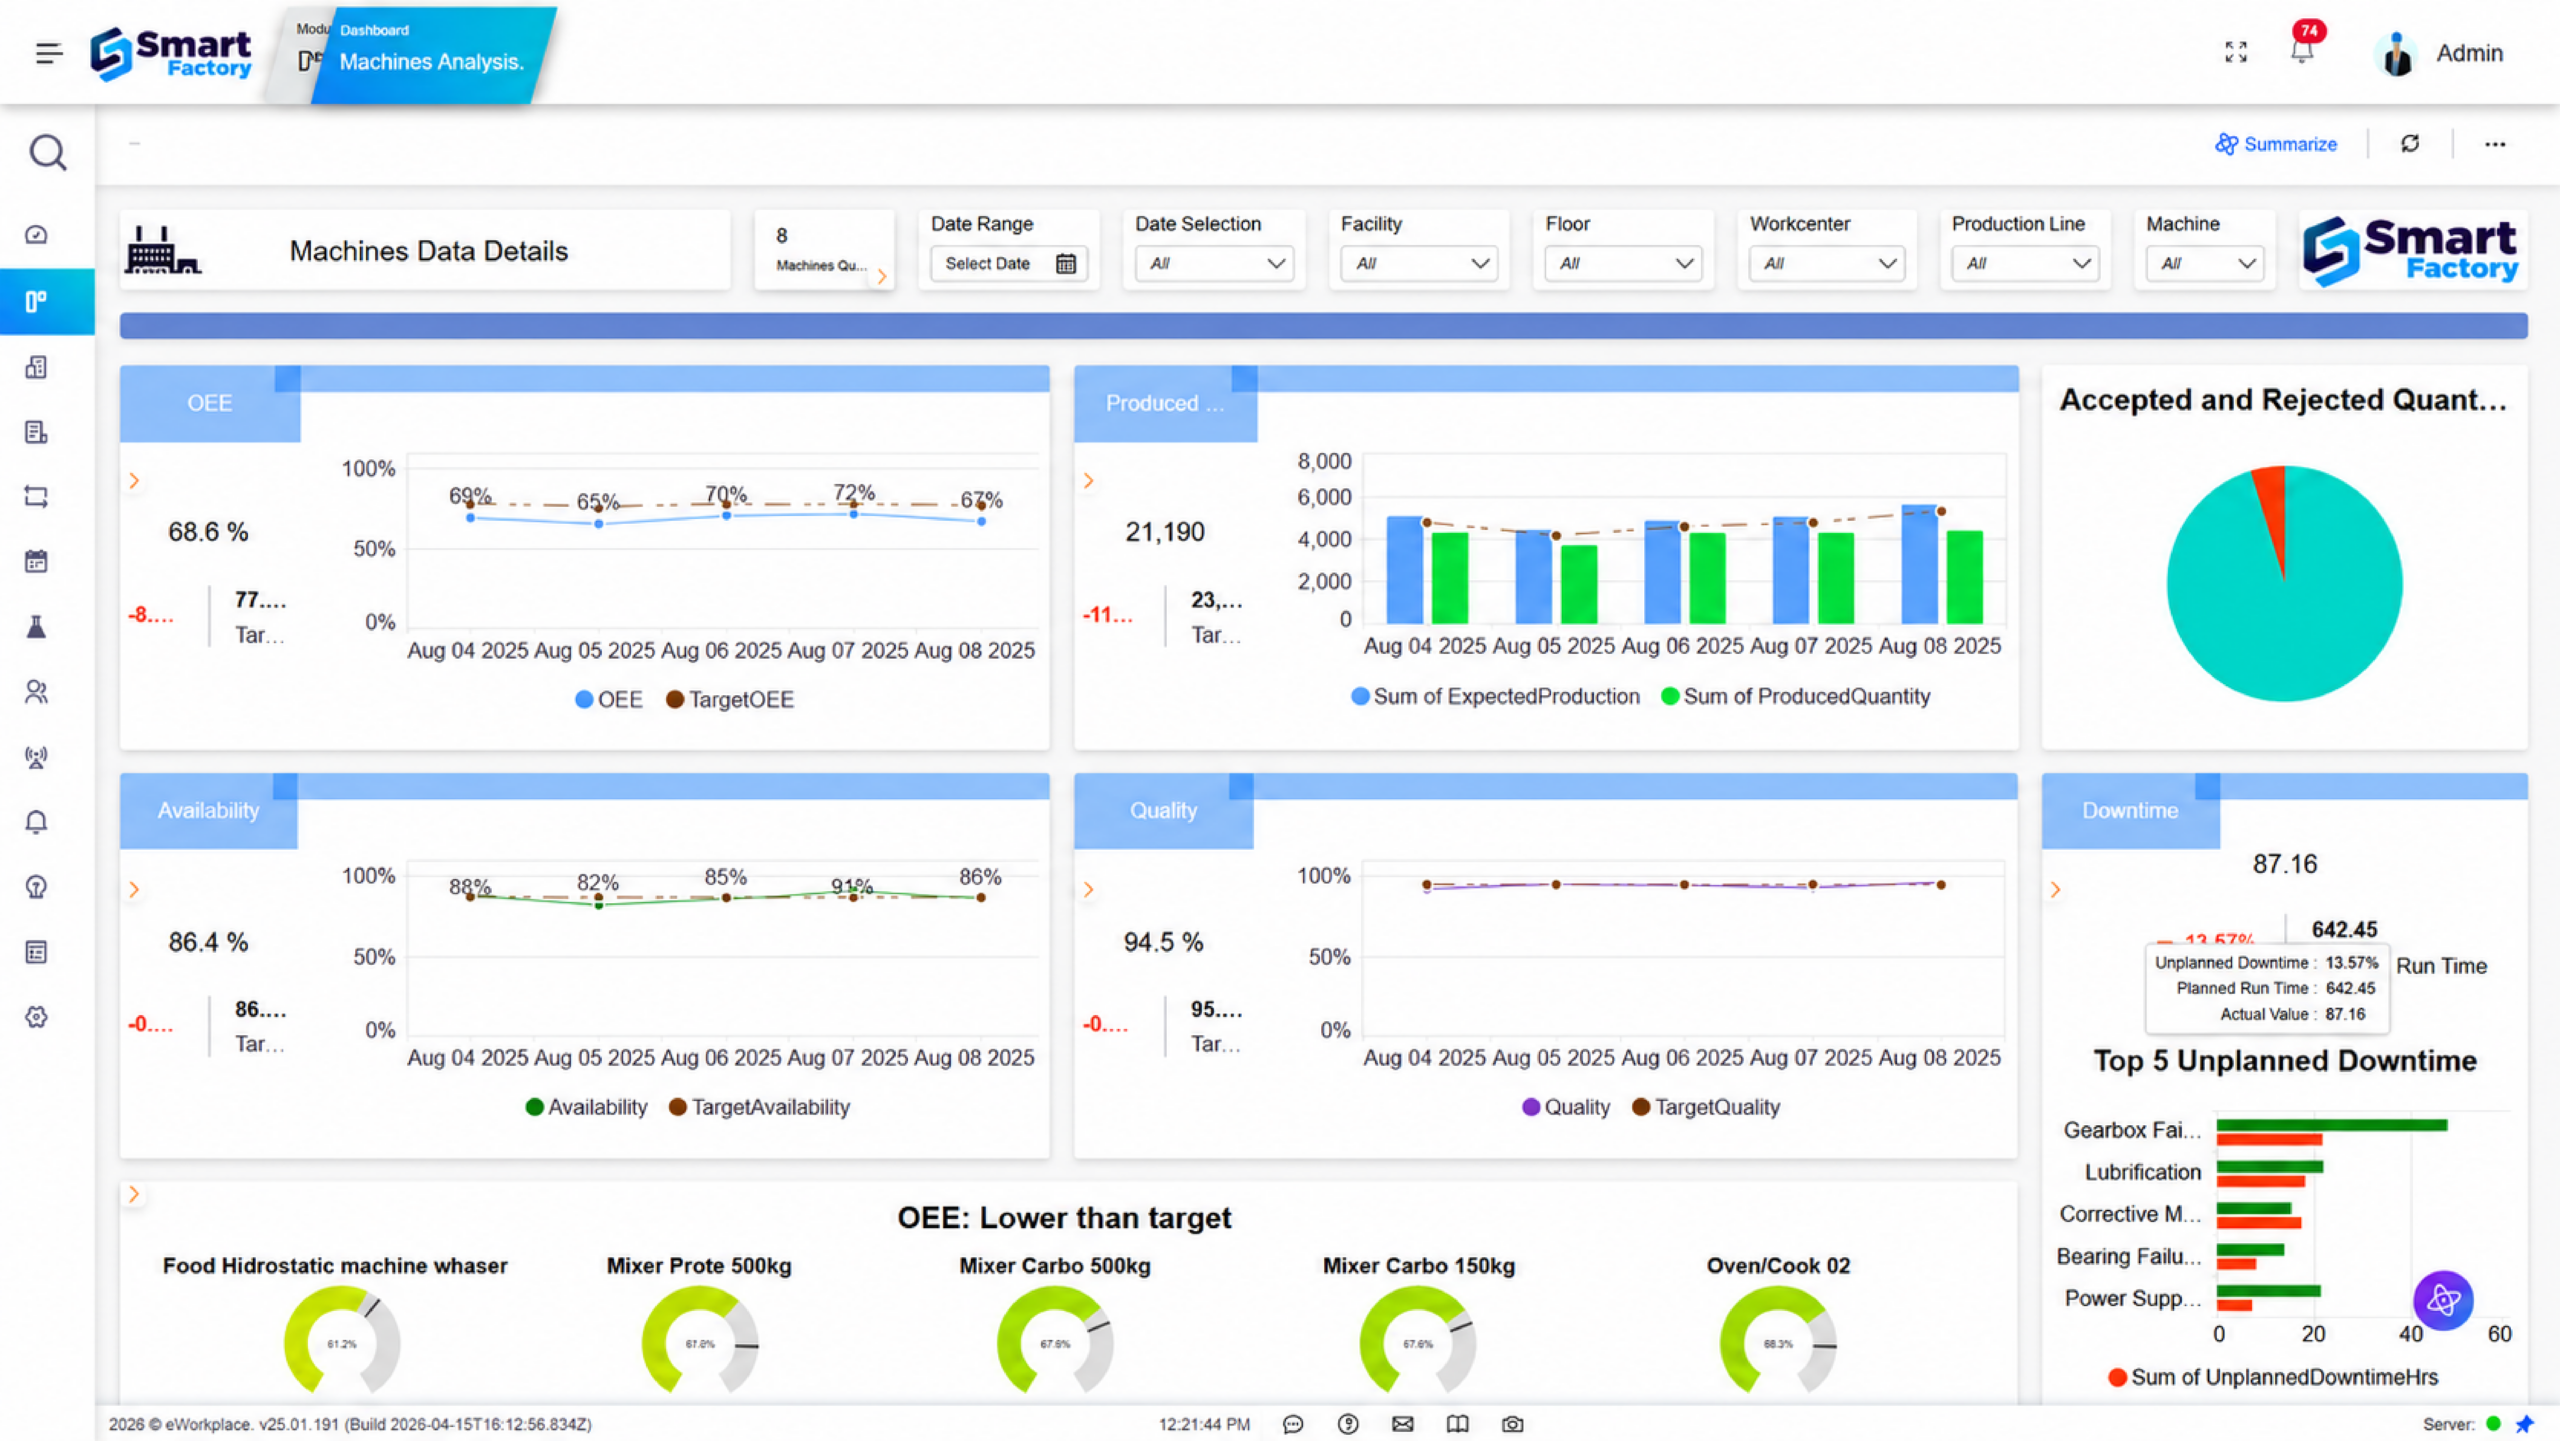
Operational overview dashboards, sometimes called control tower views, provide a high-level snapshot of the entire plant or a major process area. They typically display real-time status indicators for key production lines, a summary of OEE figures, current throughput versus plan, and any active alarms or exceptions. These dashboards are designed to assess overall performance immediately.
- A well-designed operational dashboard uses color coding: green for on-target, amber for caution, red for critical, so that attention is drawn immediately to areas needing intervention
- Trend indicators showing performance over the current shift compared to historical averages, helping managers spot emerging patterns before they become problems.
2. Production Performance Dashboard
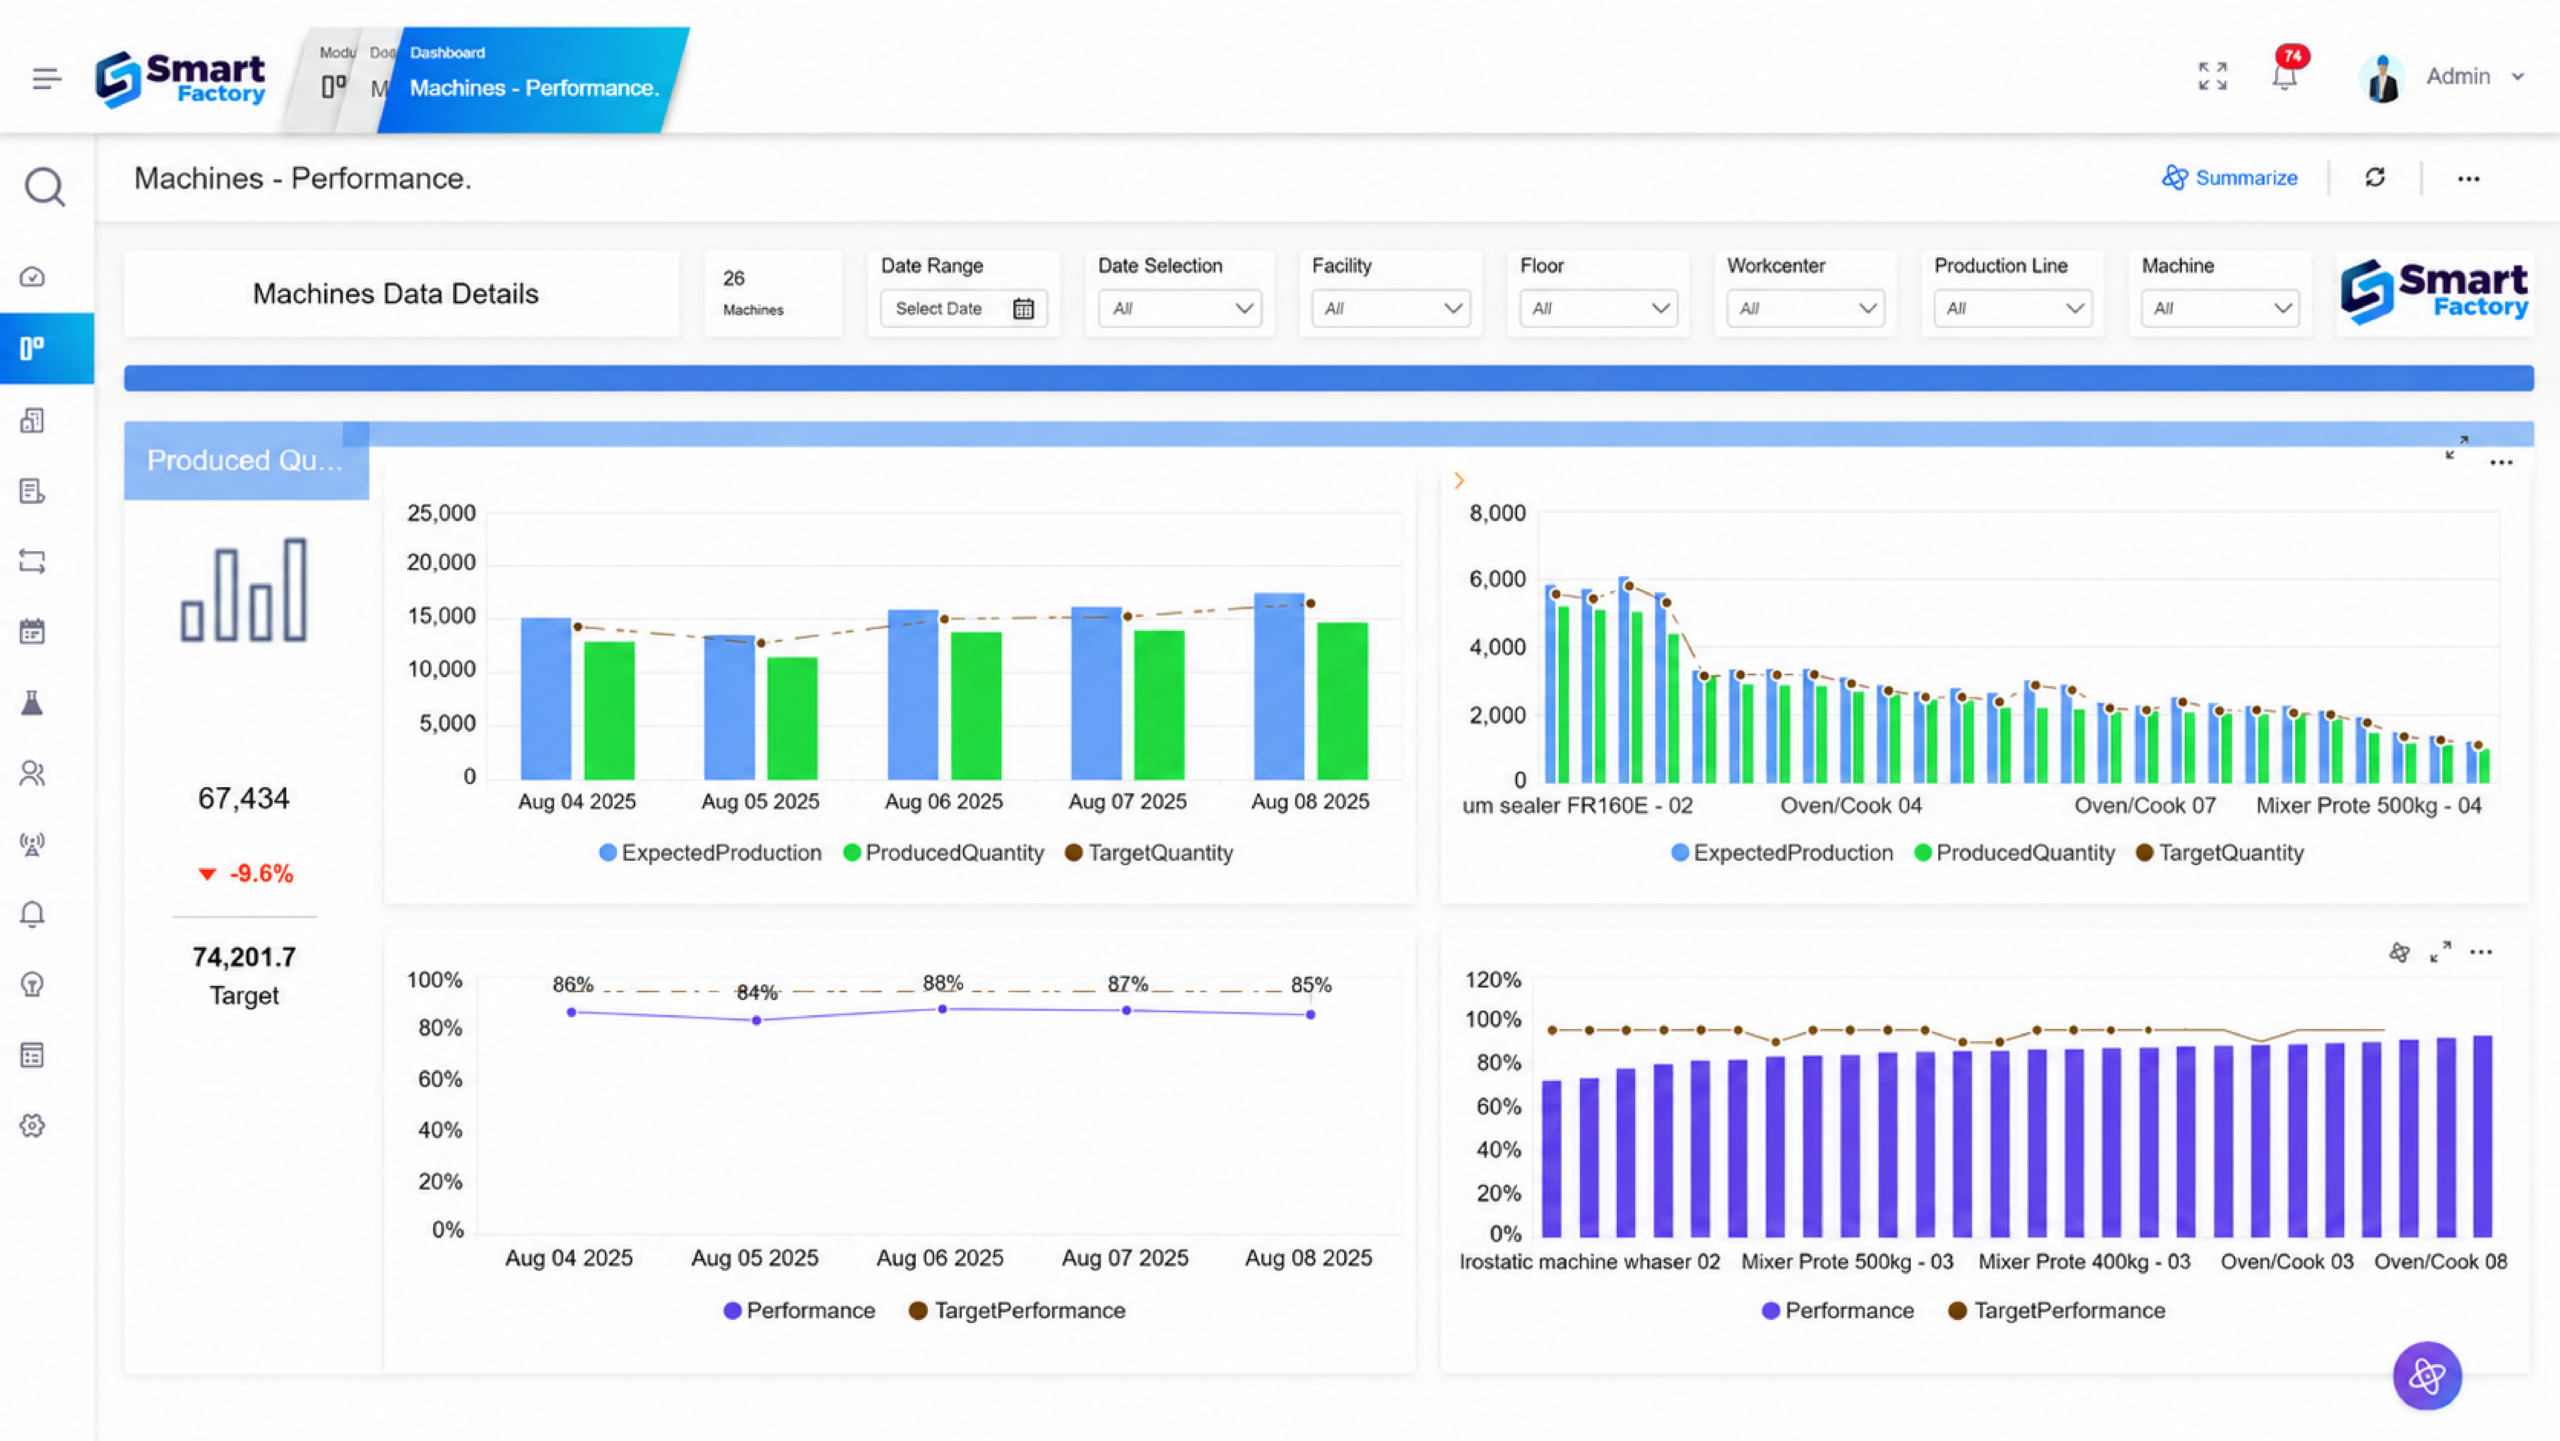
Production dashboards zoom in on the details of manufacturing execution. The production manufacturing dashboard is often the most dynamic of all dashboard types, with metrics updating every few seconds. They track metrics like the following:
- Units produced per hour
- Actual versus planned output
- Cycle times
- Takt time adherence
- Line balancing efficiency
These dashboards are primarily used by production supervisors, line leaders, and planners who need to ensure that schedules are being met, and resources are optimally deployed. For example, it identifies whether a particular workstation is consistently slower than the others and reallocates staff or triggers workflow adjustments to keep the line flowing smoothly.
3. OEE Dashboard
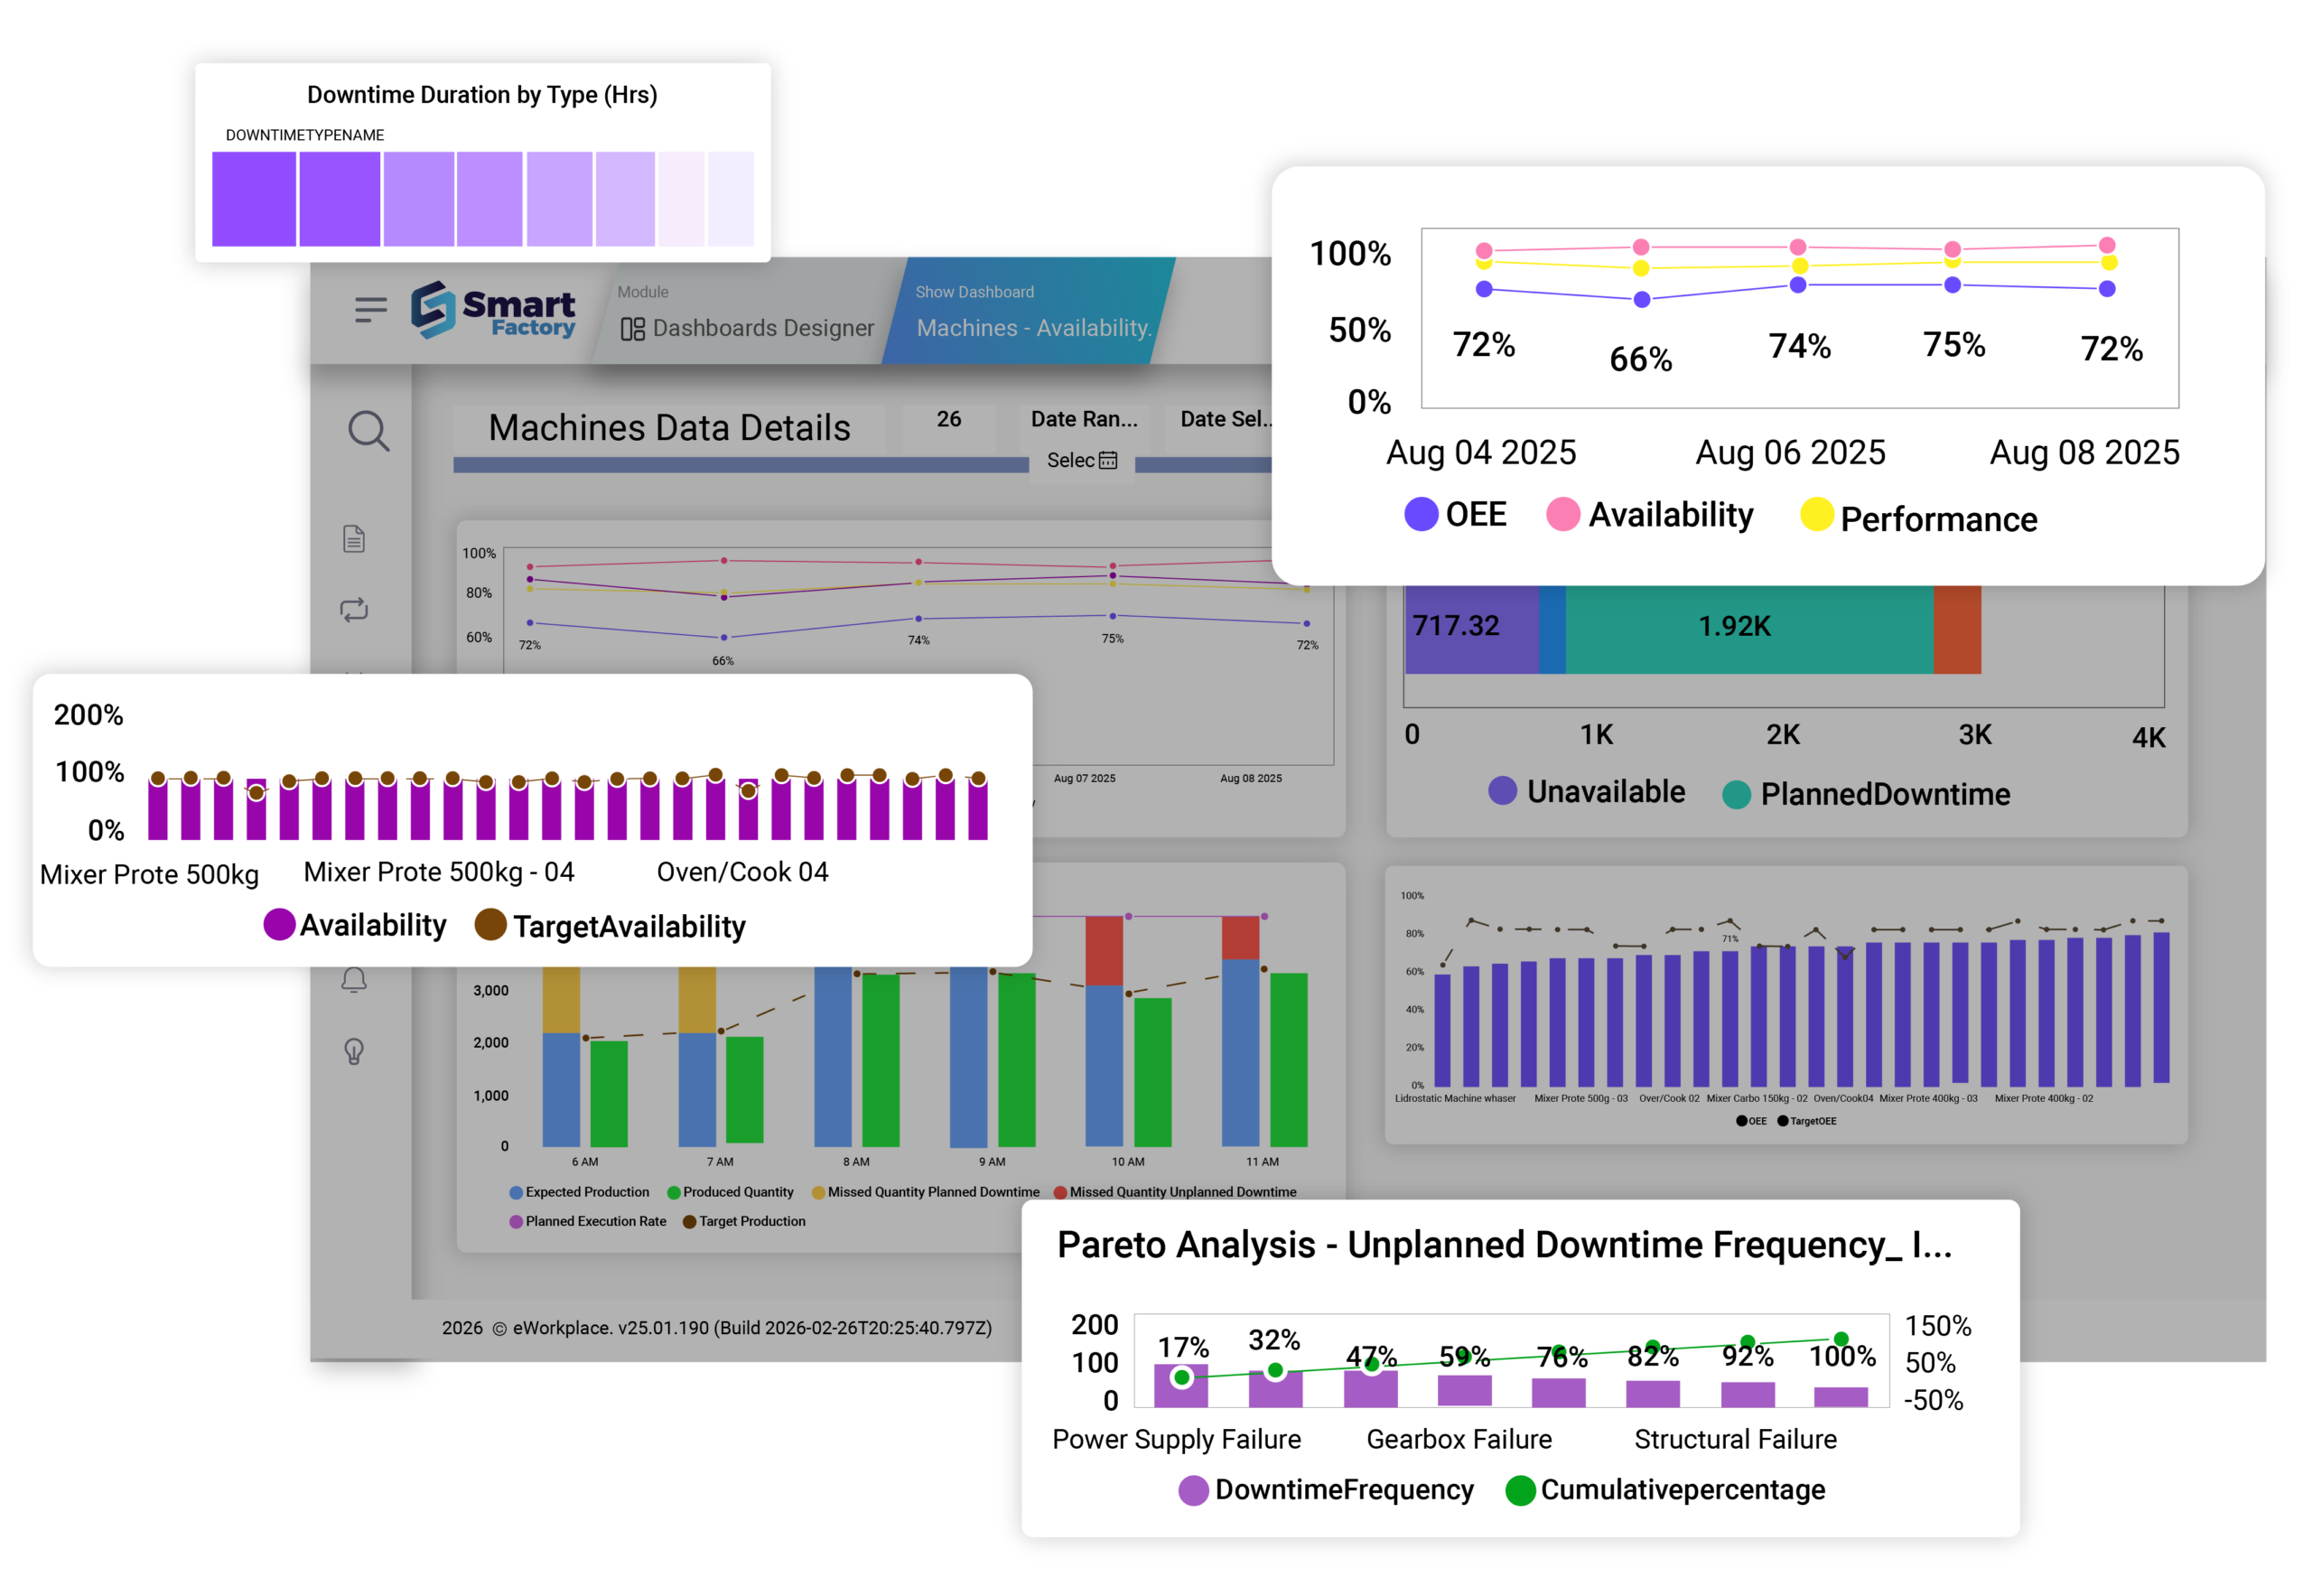
Overall Equipment Effectiveness (OEE) is arguably the most important single metric in manufacturing, and OEE-focused dashboards track its three components: availability, performance, and quality. These dashboards show not only the composite OEE calculation score but also the underlying losses: downtime events, speed losses, and quality defects so that improvement efforts can be targeted precisely.
For manufacturers asking how to implement OEE software in real time, this type of dashboard is the starting point; it provides live availability, performance, and quality breakdowns that make OEE actionable rather than just reportable.
4. Machine Utilization Dashboard
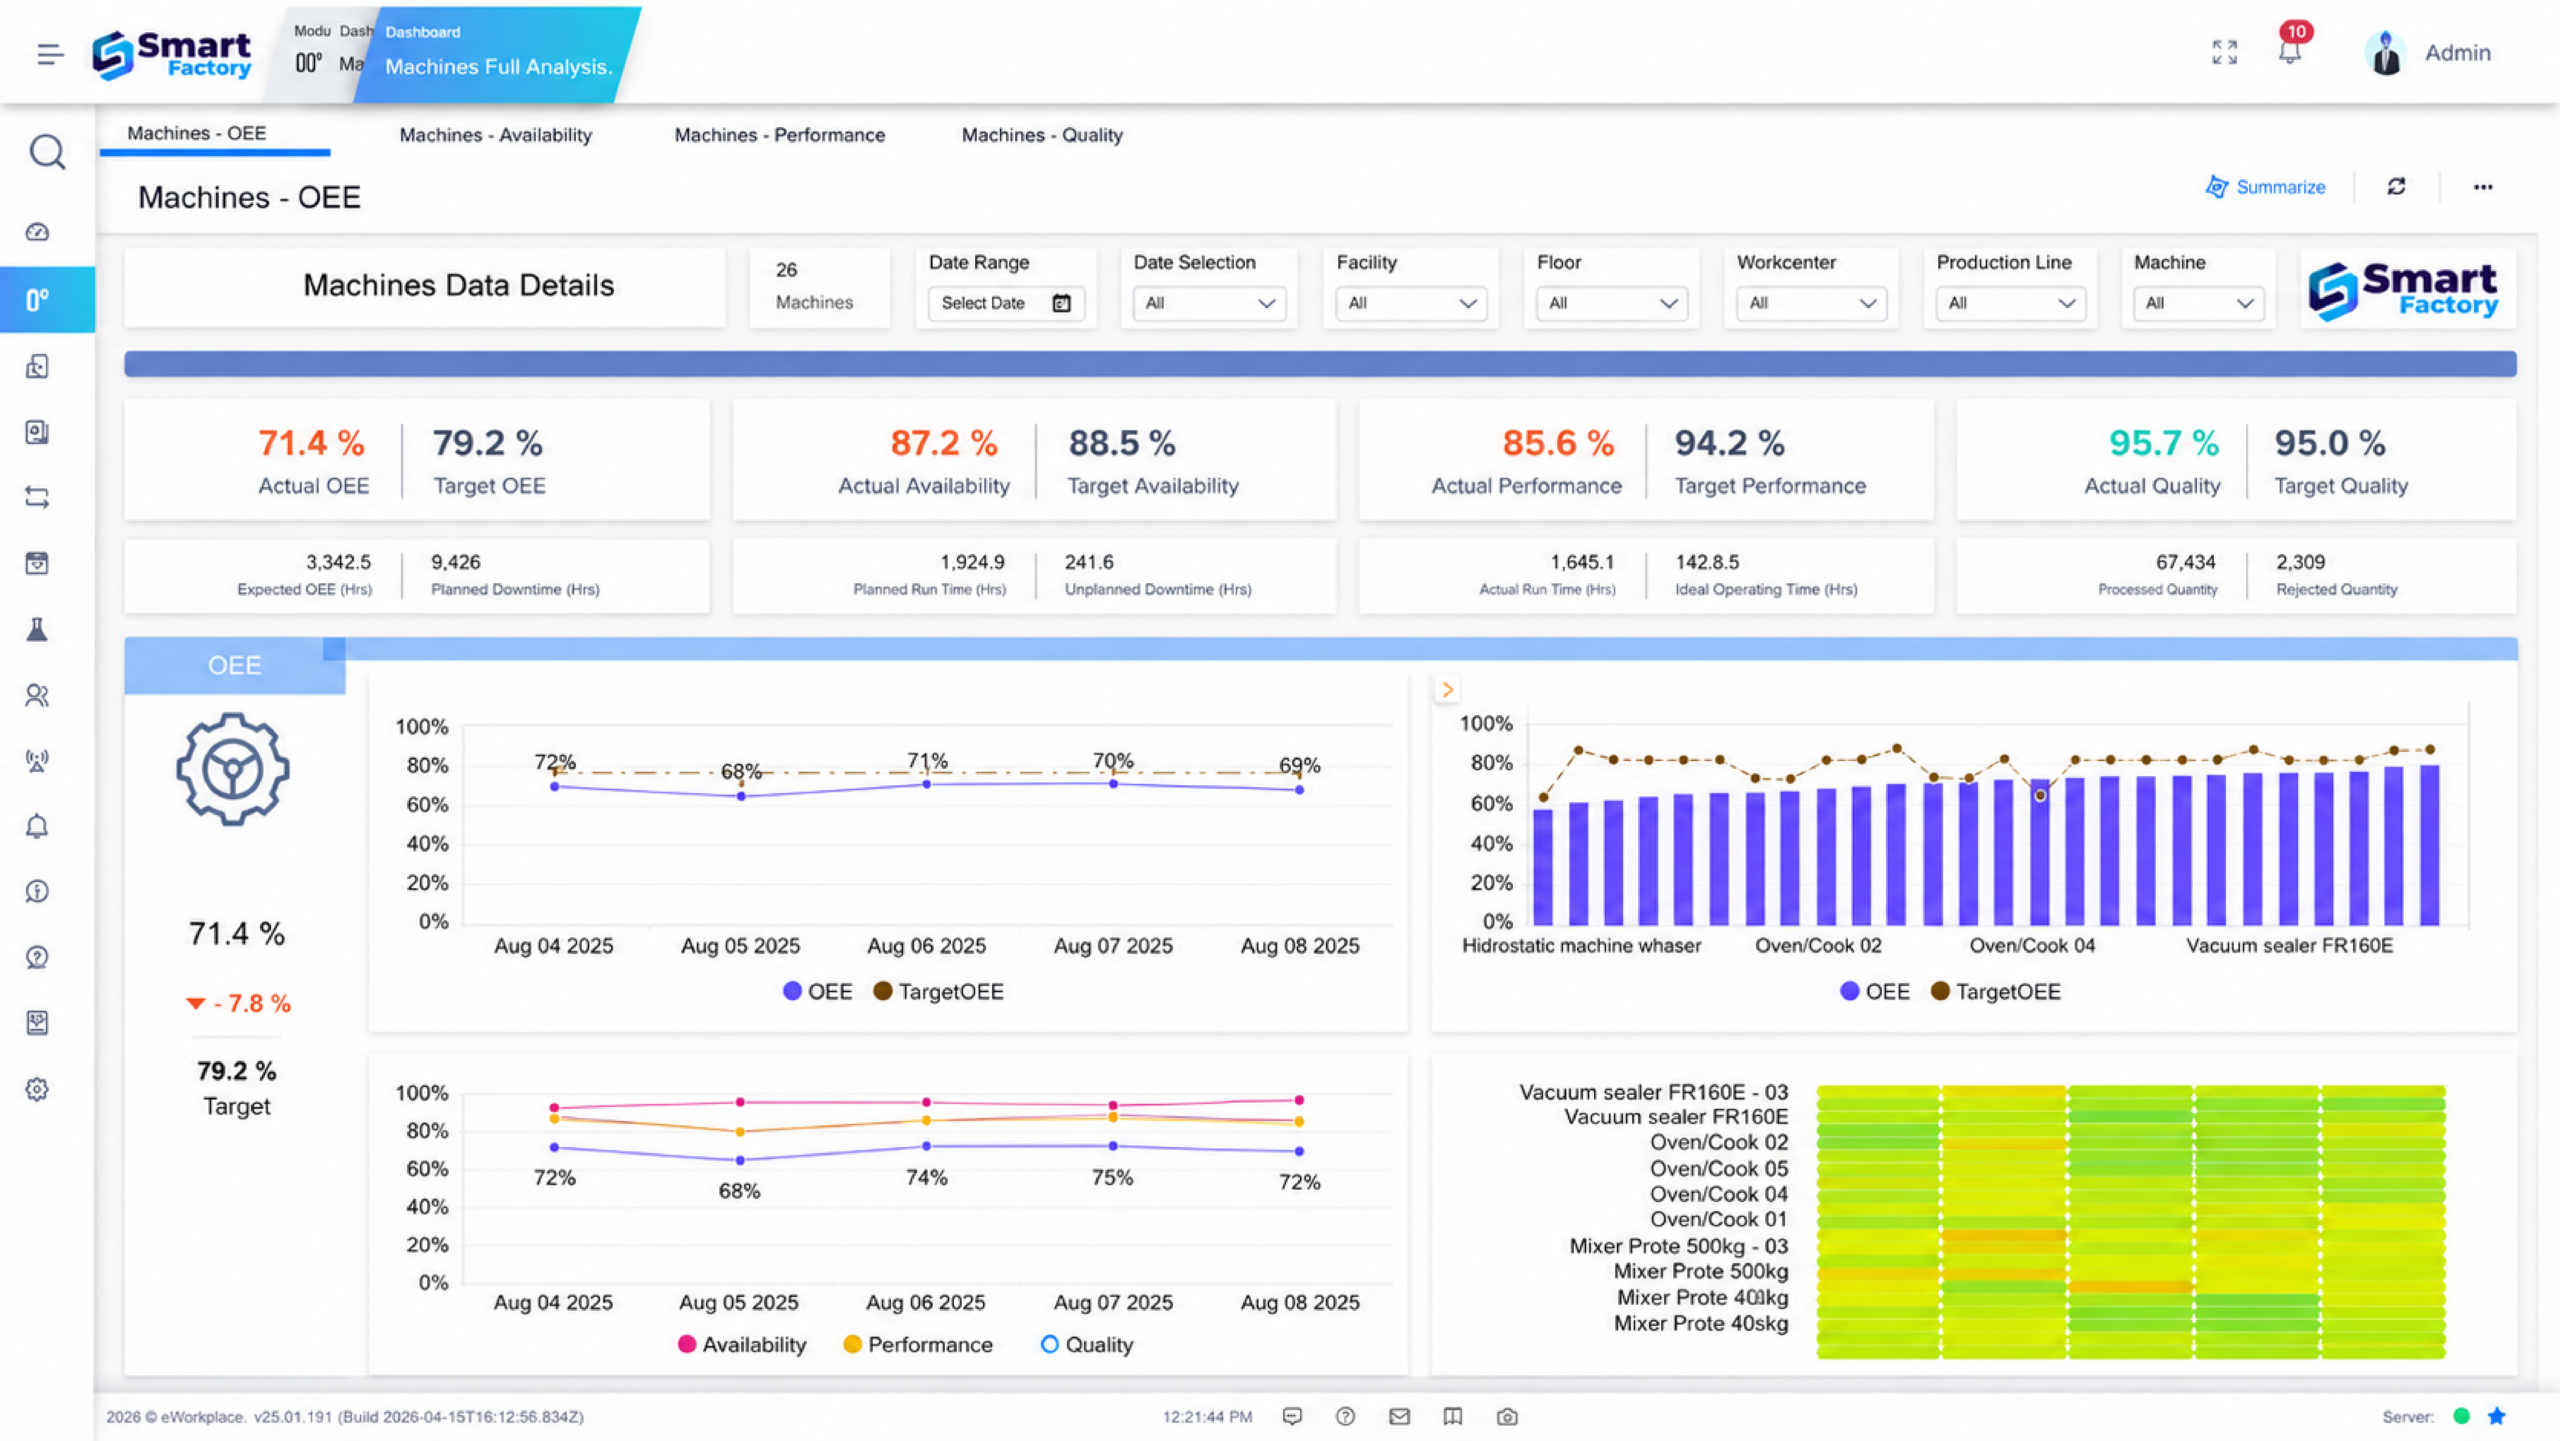
Machine utilization dashboards extend this view by tracking how effectively equipment is being used across all scheduled production time. They reveal hidden capacity, machines sitting idle during supposed production hours, and help justify capital investment decisions with hard data. For maintenance teams, these dashboards are invaluable for identifying machines that are trending toward failure based on vibration, temperature, or performance anomalies.
5. Quality Control Dashboard
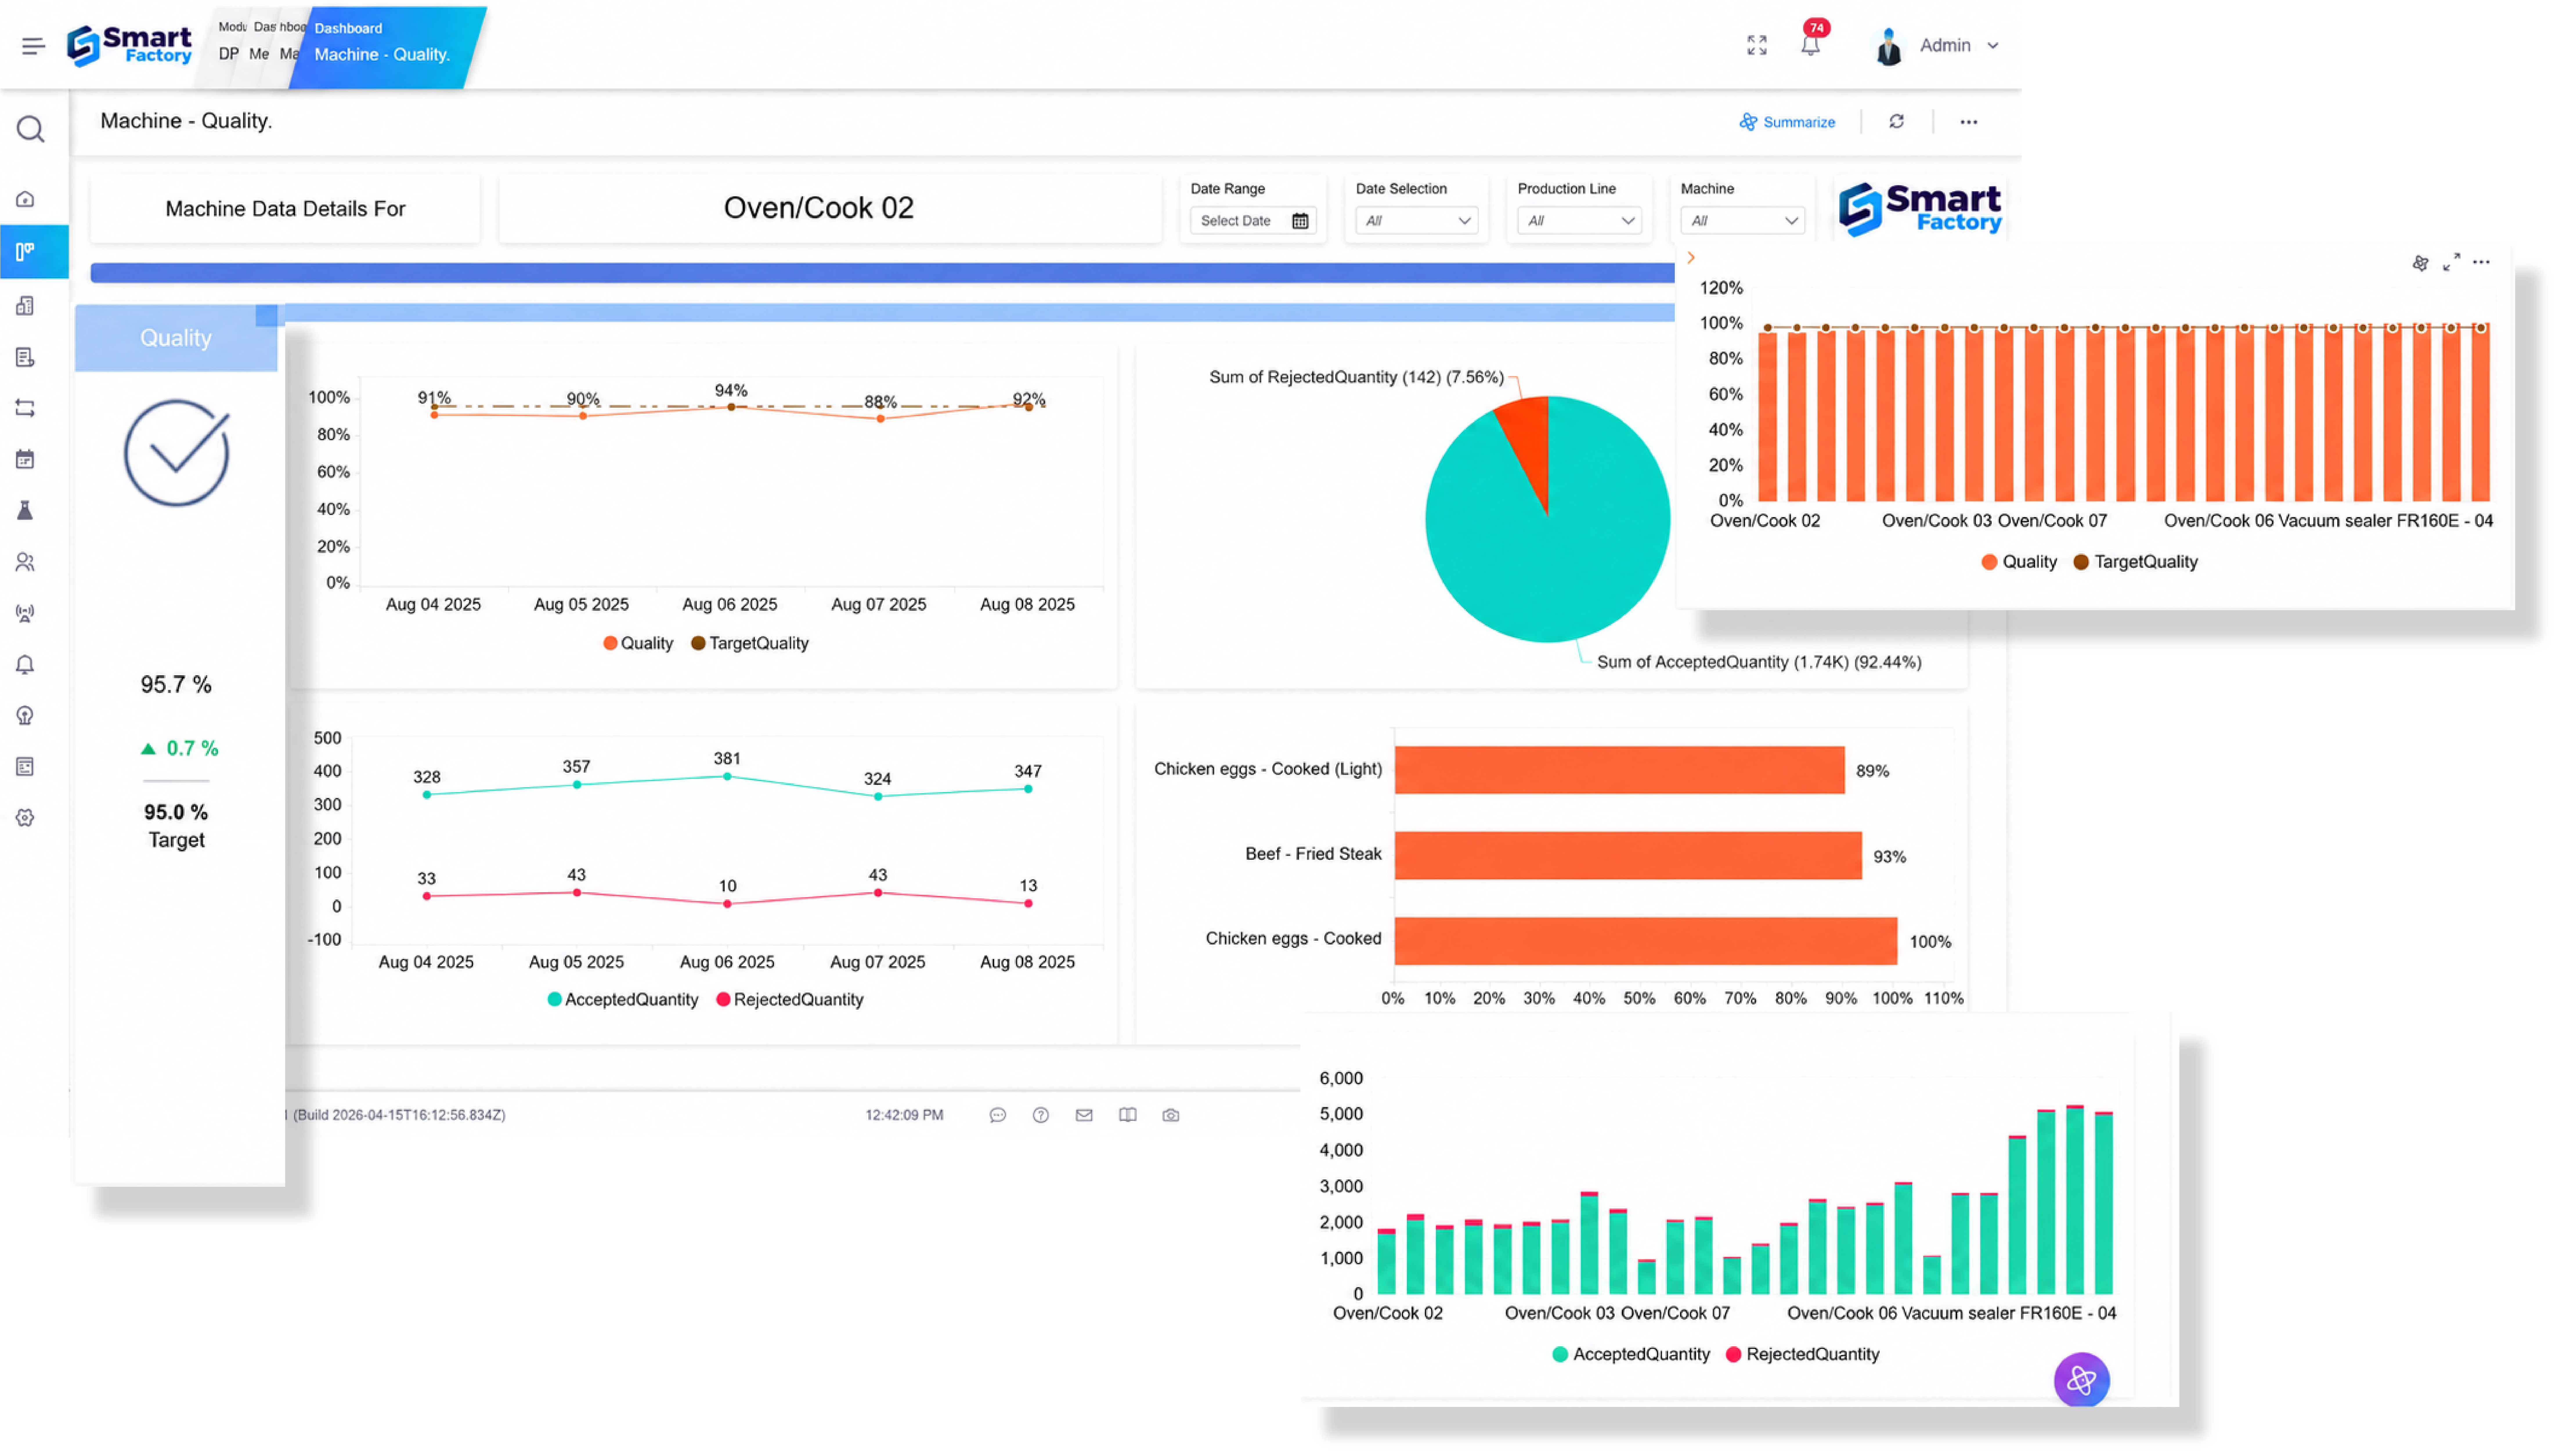
Quality dashboards focus on metrics that reflect product and process quality: first-pass yield, scrap rate, defect rates by type, supplier quality performance, and statistical process control (SPC) charts. Quality managers and process engineers use these dashboards to detect deviations from specification limits and initiate corrective actions before out-of-spec products reach customers. Quality dashboards are integrated with the manufacturing QMS system for centralizing the data.
Modern quality dashboards increasingly integrate data from automated inspection systems, coordinate measuring machines, and even operator visual checks entered through mobile devices. This multi-source integration provides a comprehensive quality picture that would be impossible to achieve through manual reporting alone.
6. Maintenance and Downtime Dashboard
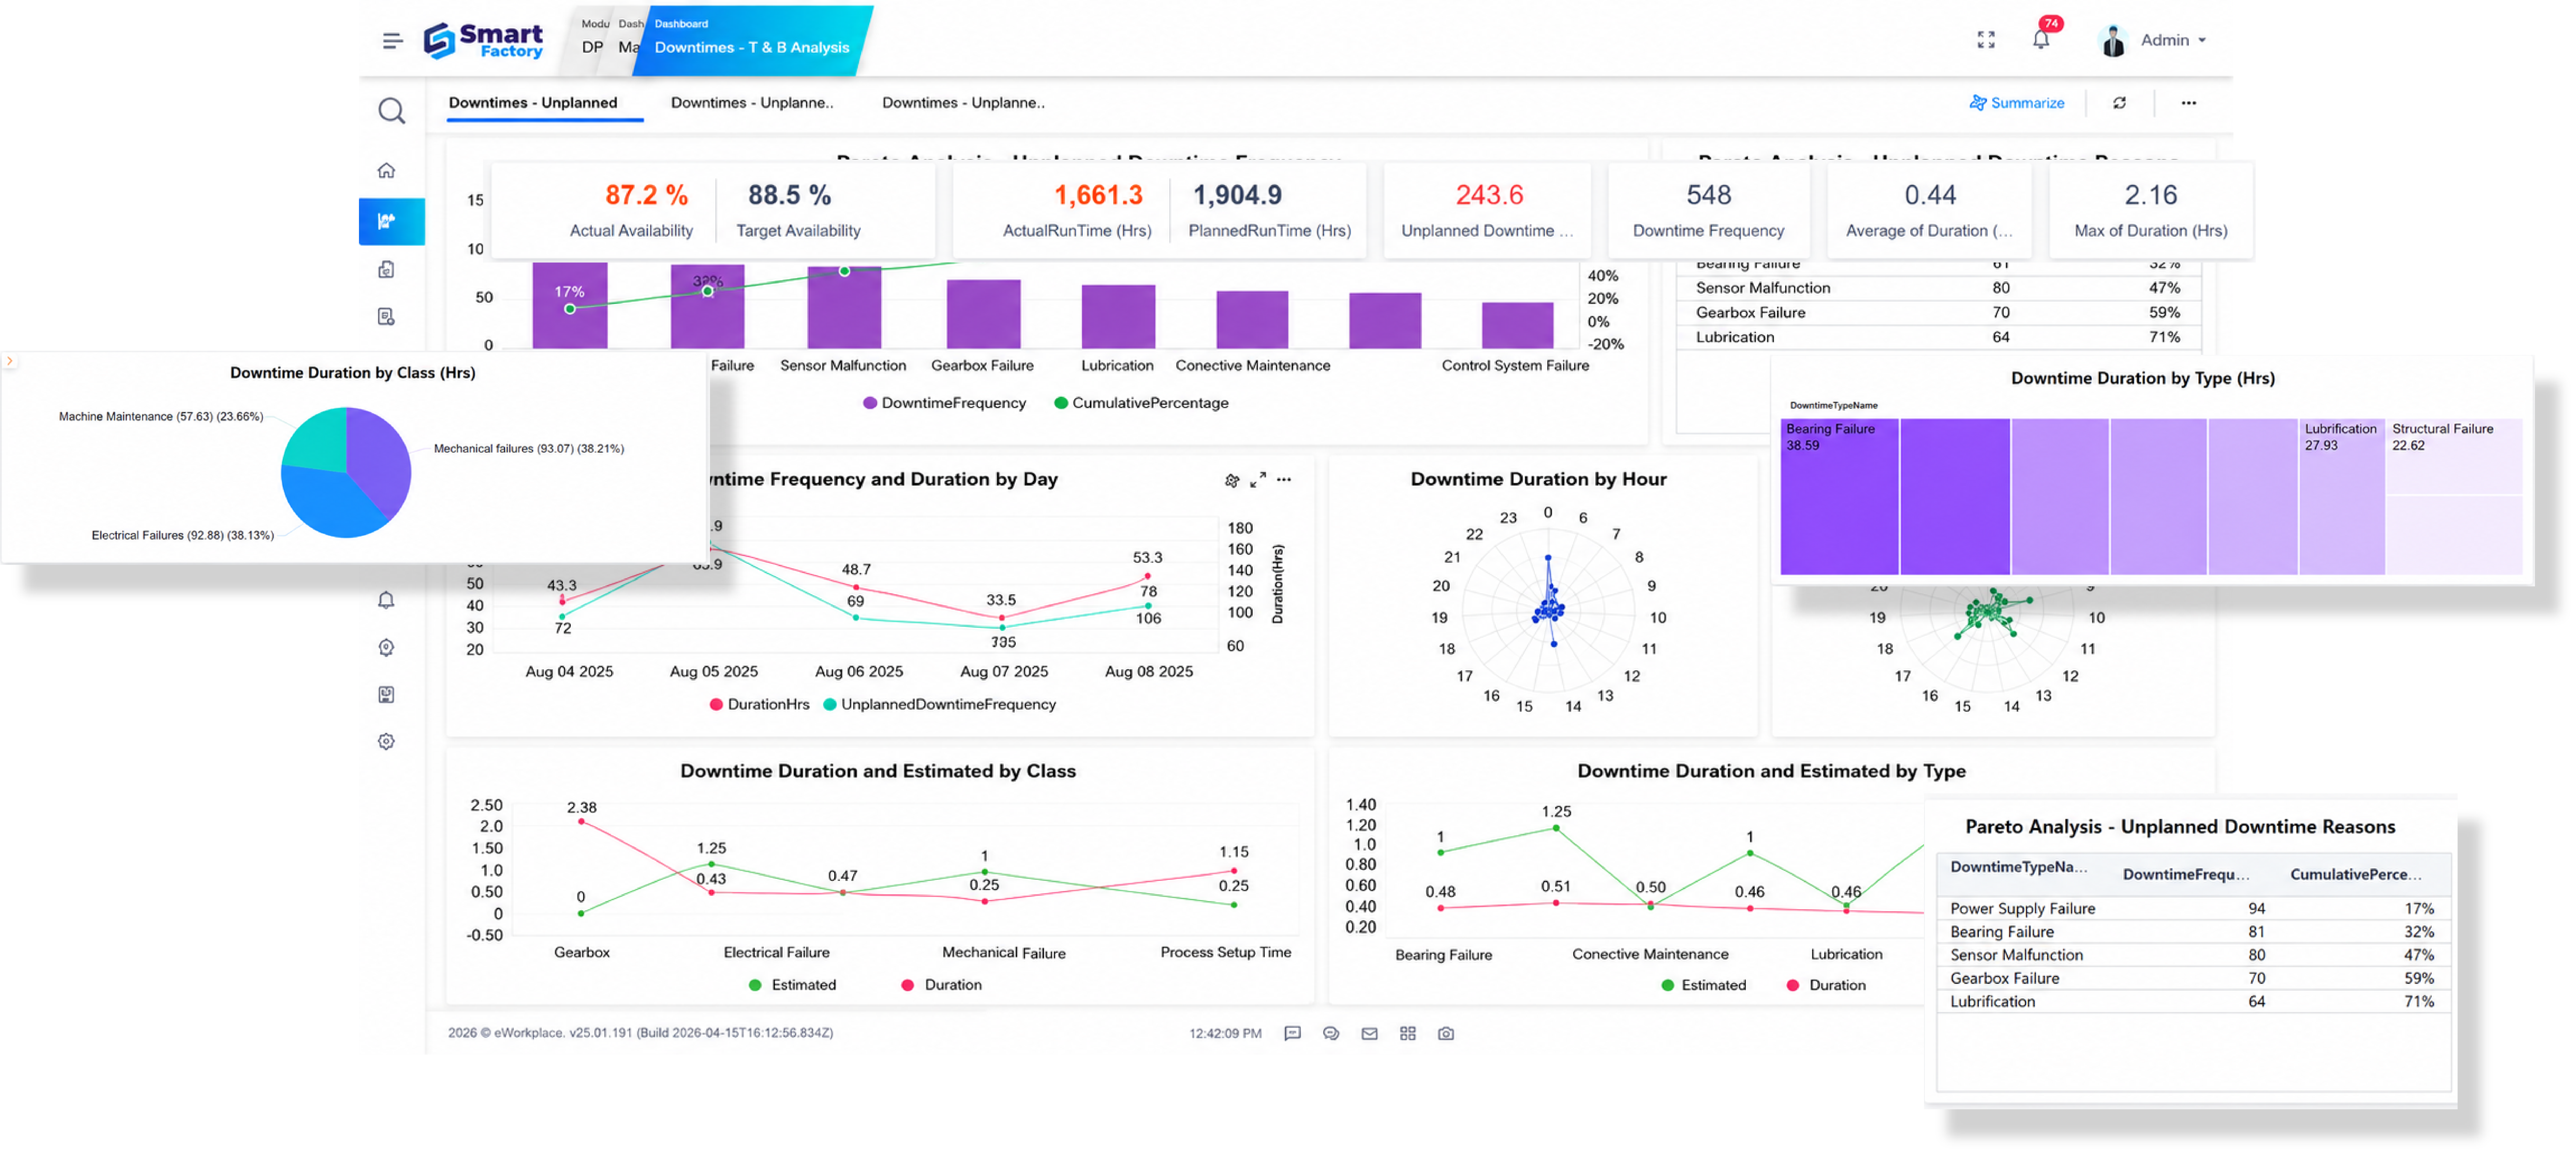
Maintenance dashboards track equipment health indicators and maintenance activity metrics. They display Mean Time Between Failures (MTBF), Mean Time to Repair (MTTR), pending maintenance work orders, spare parts inventory levels, and predictive maintenance alerts from condition monitoring sensors. These dashboards empower maintenance managers to shift from reactive break-fix approaches to proactive, predictive strategies.
Downtime tracking dashboards complement this by logging and categorizing every production interruption, whether caused by equipment failure, material shortages, operator unavailability, or quality holds. Pareto charts generated from this data help teams focus improvement efforts on the causes that contribute most to lost production time.
How to Set Up Real-Time Manufacturing Dashboards: A Practical Guide
Implementing manufacturing dashboards is not merely an IT project; it is a strategic initiative that requires careful planning, cross-functional collaboration, and a clear understanding of what success looks like.
Here are the essential steps for developing dashboards that deliver lasting value:
Step 1: Define Your Objectives and KPIs
Before selecting software or designing screens, start with the business questions you want your dashboards to answer:
- Are you primarily focused on reducing unplanned downtime?
- Improving first-pass yield?
- Increasing throughput?
Each objective will drive different KPI selections and dashboard designs. The most effective manufacturing metrics dashboards start with a small set of critical manufacturing KPIs rather than attempting to display every available data point.
Step 2: Choose Manufacturing Dashboard Software That Fits Your Environment
The market for manufacturing dashboard software spans a wide range of solutions, from simple business intelligence tools like Power BI and Tableau to specialized manufacturing analytics platforms and integrated MES solutions. When evaluating options, consider these critical factors:
| Criterion | Consideration |
|---|---|
|
Data Connectivity |
Native support for industrial protocols (OPC-UA, MTConnect, and Modbus) and the ability to integrate with existing PLCs, SCADA, and ERP systems. |
|
Real-Time Performance |
Sub-second or second-level data refresh rates for operational dashboards; edge computing capabilities to minimize latency. |
|
Visualization Flexibility |
Customizable charts, gauges, and layouts; support for wall displays, desktop, and mobile viewing; role-based views. |
|
Scalability |
Ability to start with a pilot cell or line and expand to full plant deployment without re-architecture. |
|
MES Integration |
Tight coupling with manufacturing execution functions: work orders, routing, quality checks, and maintenance scheduling. |
|
Total Cost of Ownership |
Licensing model, implementation services, training requirements, and ongoing support costs over a 5-year horizon. |
For manufacturers seeking a comprehensive solution, an integrated MES platform with built-in analytics, such as Smart Factory MOM, offers significant advantages. These platforms come with pre-built manufacturing KPI dashboards, native connectivity to industrial data sources, and the ability to drill down from high-level metrics to detailed transactional records without switching systems.
Step 3: Integrate Your Data Sources and ERP
A dashboard is only as good as the data feeding it, and for most manufacturers, that data lives in more places than you might expect machine PLCs and CNC controllers (via OPC-UA or MTConnect), SCADA systems, quality management platforms, ERP systems like SAP, Oracle, or Acumatica, workforce management tools, and manual operator inputs at workstations.
How to integrate a real-time manufacturing dashboard with existing ERP systems?
Most manufacturers achieve this through a bidirectional integration architecture. The ERP system sends production orders, routings, and schedules to the MES and dashboard layer, while the MES returns actual production data, quality results, labor information, and completion statuses back to the ERP.
With a real-time, two-way data connection, manufacturers maintain a single source of truth across operations and the business. Dashboard metrics and ERP records remain continuously synchronized, providing accurate visibility into production performance without the need for manual updates or end-of-shift reconciliation.
Edge computing architectures handle the machine-level side of this integration. Edge collectors are deployed on the shop floor to aggregate data from multiple machines, perform initial filtering, and stream clean data to central servers or cloud platforms. This reduces network load, minimizes latency, and ensures dashboards keep running even during brief network interruptions.
Step 4: Decide on the Design Views
The most common mistake in dashboard design is creating one-size-fits-all displays.
- A factory floor operator needs large, high-contrast visuals showing current machine status and target counts
- A shift supervisor needs comparative views showing performance across multiple lines and shifts
- An operations director needs rolled-up KPIs with drill-down capability to investigate exceptions
Follow these design principles for effective manufacturing dashboards:
- Place the most critical metrics at the top of the screen
- Use consistent color conventions (green/amber/red) to indicate status
- Limit each screen to the information most relevant to its intended user
- Provide drill-down paths from summary views to detailed data
- And ensure that displays are readable from appropriate distances, especially for wall-mounted shop floor screens.
Benefits of Real-Time Manufacturing Dashboards: What Changes on the Shop Floor
The investment in manufacturing dashboard technology pays dividends across virtually every dimension of manufacturing performance. Here are the most significant benefits that manufacturers consistently report.
Increased Operational Efficiency
Real-time dashboards eliminate the information delays that plague traditional reporting. When operators, supervisors, and managers all have access to current performance data, decisions happen faster and are better informed. Instead of cycling through multiple systems or spreadsheets to gather information, users see consolidated views that highlight exactly what needs attention. This efficiency gain translates into more time spent on value-adding activities and less on information gathering.
Reduced Downtime and Maintenance Costs
Real-time dashboards, particularly those integrated with condition monitoring sensors, enable predictive maintenance strategies that identify equipment degradation before failure occurs. By detecting early warning signs such as abnormal vibration patterns, temperature excursions, or performance drift, maintenance teams can schedule interventions during planned windows rather than responding to emergency breakdowns.
“Smart Factory MOM customers report up to 30% reduction in unplanned downtime, a result of combining predictive maintenance alerts, machine condition monitoring, and real-time deviation notifications that give maintenance teams time to act before failures occur.”
Improved Quality and Reduced Waste
Quality dashboards enable early detection of process deviations that could lead to defects. When SPC charts show a trend toward control limits, or when first-pass yield drops below historical norms, quality teams can investigate root causes while the number of affected parts remains small. This early intervention reduces scrap, rework, and the risk of shipping defective products to customers.
The data captured in quality dashboards also support long-term improvement initiatives. Pareto analysis of defect types reveals which issues consume the most resources, helping teams prioritize improvement projects for maximum impact. Over time, this data-driven approach to quality management drives consistent, measurable reductions in cost of poor quality.
Enhanced Communication and Accountability
Cross-functional teams: production, quality, maintenance, and planning can reference the same data sources, eliminating the conflicting versions of truth that often derail collaborative problem-solving.
Dashboards also strengthen accountability by making performance expectations explicit and progress measurable. When OEE targets, throughput goals, and quality standards are displayed prominently, teams develop ownership over their results. This transparency, combined with recognition for achievements, builds a culture of continuous improvement that sustains gains over the long term.
Data-Driven Strategic Decision-Making
While much of the value from dashboards comes from real-time operational improvements, the historical data they accumulate becomes a strategic asset. Trend analysis reveals seasonal patterns, capacity constraints, and opportunities for improvement. This helps make informed decisions related to capital investment, product mix, staffing levels, and technology upgrades.
Manufacturing dashboards integrated with MES and ERP systems, connect shop-floor performance to business outcomes. It correlates OEE improvements with cost per unit reductions, or throughput gains with on-time delivery improvements.
| Benefit Area | Impact |
|---|---|
|
Operational Efficiency |
5-15% throughput improvement; 70% faster issue detection; reduced time spent gathering information |
|
Downtime Reduction |
Up to 30% reduction in unplanned downtime through predictive maintenance and early intervention |
|
Quality Improvement |
Early detection of process deviations; reduced scrap and rework; lower cost of poor quality |
|
Decision Speed |
30% improvement in decision-making time through real-time visibility and shared data |
|
On-Time Delivery |
Up to 36% increase in on-time deliveries through better production control and bottleneck management |
|
Cultural Impact |
Enhanced accountability, transparency, and continuous improvement mindset across the organization |
See these results on your own shop floor. Smart Factory MOM’s real-time dashboards give you live OEE, production performance, and quality tracking out of the box, with native MES and ERP integration.
The Role of MES in Real-Time Manufacturing Dashboards
While standalone dashboard tools can deliver value, the most powerful manufacturing dashboards are built on a Manufacturing Execution System (MES). The MES serves as the central nervous system of the smart factory:
- Collecting data from every machine, transaction, and operator interaction
- Contextualizing it with order and routing information from the ERP
- And making it available for real-time visualization and historical analysis.
An MES-integrated manufacturing dashboard offers several advantages over standalone business intelligence approaches.
Built-In Data Connectivity
The MES already has the protocols, drivers, and data models needed to collect information from industrial equipment.
Richer Data Context
The MES knows what product is being run, what operations are scheduled, and what specifications apply; dashboard metrics can be interpreted in their proper operational context. T
Closed-Loop Action
When a dashboard reveals a problem, the MES can trigger workflows, dispatch notifications, and even adjust machine parameters automatically.
Conclusion
Real-time manufacturing dashboards have evolved from a competitive differentiator to an imperative tool for manufacturers running lean, responsive operations. The reasons are straightforward: the speed of modern production environments, the accuracy of inventory buffers, and the complexity of customer expectations have made delayed information a genuine liability.
The factories that will thrive in the coming decade are those that treat data as a strategic asset and equip their people with the real-time insights needed to make better decisions, faster. Manufacturing dashboards are the window into that data-driven future, and the time to build that capability is now.
If you are evaluating your options, a practical starting point is a platform that handles machine connectivity, MES execution, and analytics in one environment. Smart Factory MOM is built specifically for small and mid-size manufacturers who need enterprise-grade visibility without enterprise-scale implementation complexity.
The main essential KPIs are OEE, throughput, downtime by cause, first-pass yield, scrap rate, cycle time, on-time delivery, and maintenance metrics (MTBF/MTTR). These metrics tell you how well a plant is running without overwhelming operators with data.
Choose a dashboard based on how easily it connects to your existing machines, ERP, and shop floor processes, not just its features list. Look for cloud-based tools that deploy fast, work on mobile devices, and don’t require an IT overhaul. Also check that it scales as you add lines or plants, since switching platforms later is costly.
Real-time monitoring improves OEE by reducing the time between a problem happening and someone responding to it. Instead of discovering a slowdown at the end of the shift, supervisors see it the moment it starts and can act immediately. It breaks down the impact on all three OEE components: availability, performance, and quality.
The top features for a real-time manufacturing dashboard solution are:
- Automatic data collection
- Role-based views
- Real-time alerts
- Historical trend data
- And mobile access.
Automatic data collection matters most, since manual entry is slow and often wrong. Role-based views keep the dashboard useful for both operators and managers, showing each person only what’s relevant to their job
Look for a system that automatically captures machine data and breaks OEE into its three parts: availability, performance, and quality. This breakdown shows exactly where losses are happening instead of just giving one overall score. Downtime reason tracking and the ability to compare OEE across shifts or lines are also important for spotting where support is needed.
Manufacturing KPI dashboards integrate with ERP systems through APIs that sync production data, like output, scrap, and downtime, directly into inventory and costing records. This removes manual double-entry and keeps both systems accurate in real time. This kind of connection is what separates a basic MES from a full manufacturing operations management platform, since it ties shop floor activity to planning and finance.